


 14 / 24

Company Background
Genting Singapore
PLC (Genting SP) was
incorporated in Aug 1984 and
specialises in international
gaming, developing/operating
casinos and integrated
resorts. In Feb 2005 and Apr
2005, the company entered
a joint submission with Star
Cruise Limited and a joint
collaboration with Universal
Parks & Resorts for the
proposed integrated resort
in Sentosa Island.
During that period,
the company also
acquired stakes
in UK casino
companies like
Maxims Casino
Club London,
Stanley Leisure
PLC and London
Clubs International
PLC. The company
went listed on
the mainboard
of the SGX in
Dec 2005 and
was awarded the
Sentosa Integrated
Resort project
in Dec 2006. Genting SP
initially owned 75% of the JV
while Star Cruise took the
remaining 25%. Genting SP
subsequently acquired Star
Cruise’s 25% stake for S$255
mln in May 2007.
Over the next few years,
Genting SP issued two rounds
of convertible bonds (a total
of S$875 mln that was fully
converted into shares) along
with two rounds of rights
issuances, and secured
S$4.19 bln syndicated
loans for the construction of
the integrated resort. The
company also raised its
stakes in some of the UK
casino operations in 2006, but
the segment was eventually
disposed in Oct 2012.
In Jan 2010, the company
announced the phased
opening of the integrated
resort followed by Universal
Studio Singapore’s soft
opening two months later.
Another major development
for Genting SP was the
winning of state tender for
the first hotel development
in Jurong in late 2012. The
557-room Genting Hotel
Jurong (GHJ) had its official
opening in mid-2015 and
offers a free round-the-clock
shuttle bus service between
the hotel and Resorts World
Sentosa (RWS). In Apr 2014,
Genting SP completed the
proposed investment for a
50% stake in an integrated
resort in Jeju, South Korea
(called Resorts World
Jeju, RWJ). The site’s
ground-breaking ceremony
was carried out in Feb 2015;
it is projected to be opened
progressively from 2017 and
fully completed in 2019.
Business model – A Family
Oriented Resort That Can
Attract Visitors
Today, Genting SP is
engaged in the development
and operation of large-scale
integrated resorts and is
best known for its flagship
project, RWS. The 49-hectare
resort features 1) South-East
Asia’s first and only Universal
Studios theme park, which
has seven themed zones
and other attractions like
the Maritime Experiential
Museum and Aquarium,
Adventure Cove Waterpark,
and Dolphin Island, 2) more
than 1,500 rooms across
six hotel themes with full
conference and meeting
facilities, 3) the Resorts World
Casino and 4) various food
and beverage outlets as well
as specialty retail outlets. The
resort is family-oriented and
aims to attract both local and
overseas customers.
The key attraction of
RWS is Universal Studios
Singapore (USS), which has
a daily average visitation of
more than 18,000 over the
past 12 months, while the
RWS hotel occupancy rate is
around 92% with an average
room rate of around S$400
TURN TO PAGE 15
per night. Even though the
resort is new, the team has
been adding new attractions
such as Dolphin Island at
Marine Life Park in Sep 2013
and Puss in Boots at USS in
Apr 2015.
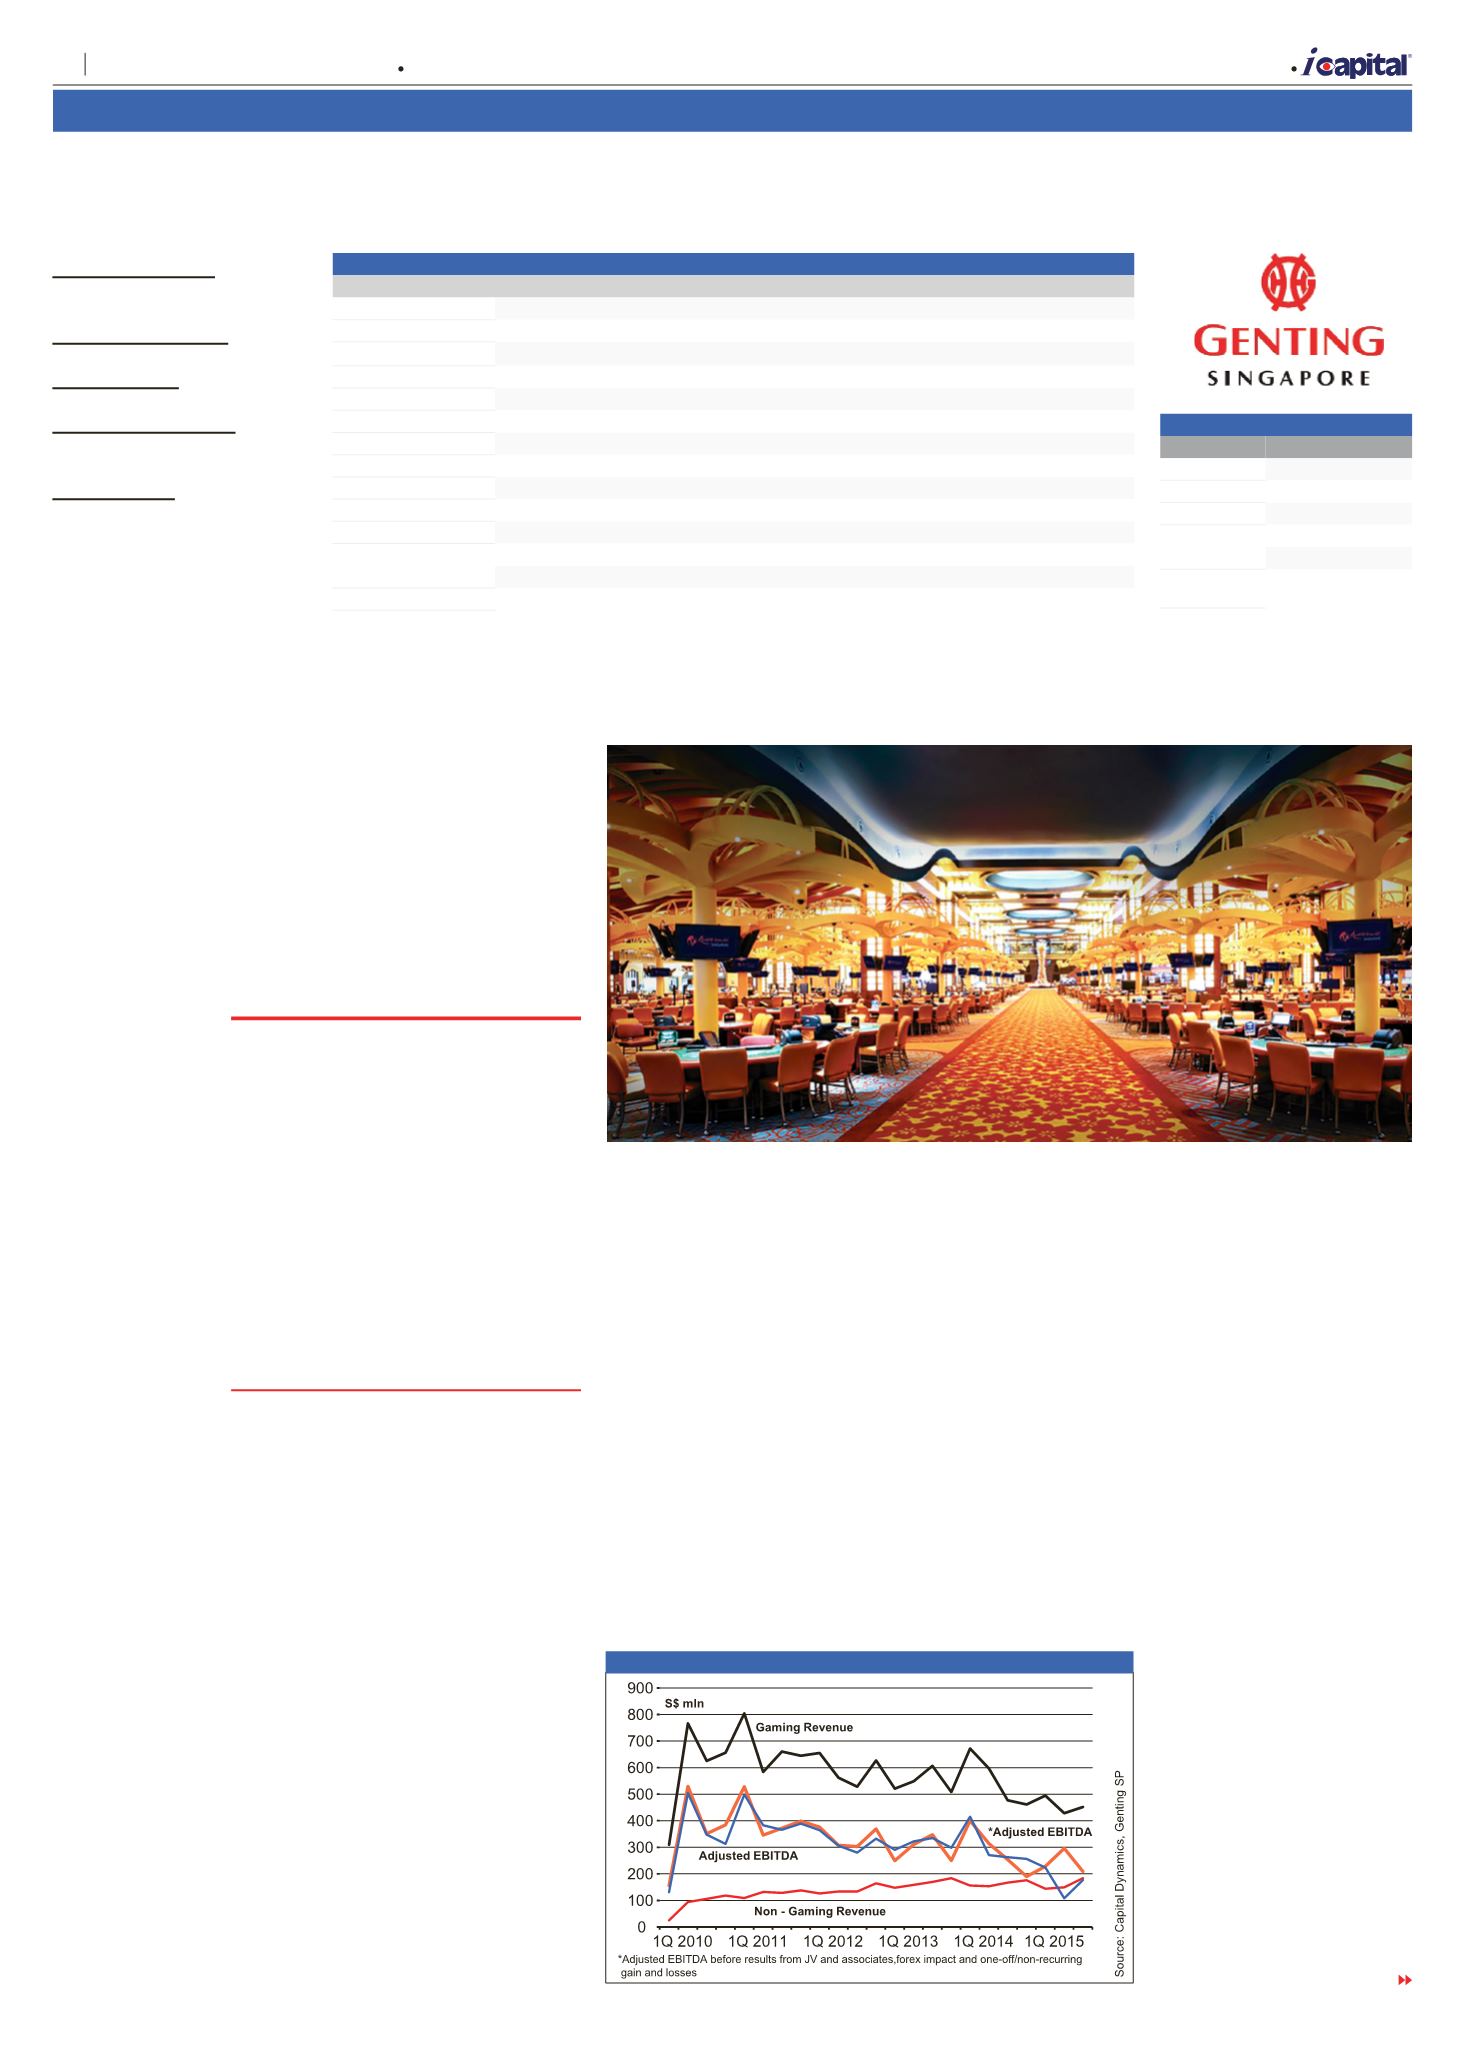
GHJ is the first major
hotel in the Jurong Lake
District with proximity to an
international business park,
the Jurong East Bus Terminal,
an MRT station as well as
shopping malls. Although the
hotel has a short operating
history, its occupancy rate is
now around 80% and it has a
net positive impact on RWS,
as seen from the uptick in
non-gaming revenue in 3Q
FY2015 – see
figure 1
.
To Genting SP, the
key revenue generator is
Resorts World Casino, which
comprises 15,000 sqm of
net gaming space that spans
the main gaming floor and
high-limits gaming area
(consisting of Crockfords
Club, Maxims Platinum and
Maxims Club). The games
include baccarat, blackjack,
Caribbean stud poker,
roulette, Texas hold’em poker,
tai sai, poker and others. The
key visitors are mainly from
Singapore (locals and PRs),
Malaysia, Indonesia, the
Philippines and China. Under
the VIP premium segment,
the bulk of the players are
from North Asia (mainly
China) and these players are
given chips on credit terms,
unlike the mass market or
premium mass players who
pay cash. The company has
adjusted their credit policies
over the last two years due
to rising receivables and slow
payment by some of the VIP
players. The management’s
current strategy is to grow
the premium mass and mass
business segments while they
restructure the VIP segment.
Genting SP owns a 50%
stake in RWJ while the other
50% is owned by Hong Kong
listed Landing International
“The key attraction in
RWS is Universal Studios
Singapore (USS) which has
a daily average visitation
of more than 18,000 over
the past 12 months, while
the RWS hotel occupancy
rate is around 92% with
an average room rate of
around S$400 per night.”
Source:
www.rwsentosa.comResorts World Sentosa Casino
Principal activities
Leisure, hospitality and
gaming.
Major shareholder/s
Tan Sri Lim Kok Thay.
Latest paid-up
12.1 bln shares
Market capitalisation
S$8.22 bln @ S$0.68 per
share
2016 PE Ratio
Around 43.4 times @ S$0.68
per share
*: Include Perpetual Capital Securities
Sources: Genting SP, Capital
Dynamics, SGX
B.2. Genting Singapore PLC (GENTING SP, G13)
Financial highlights (S$ mln) – 31 December
2005 2006 2007 2008 2009 2010 2011 2012 2013 2014
Sales
81.00 292.9 751.7 643.8 49.50 2753 3223 2948 2847 2863
Pre-tax profit
116.3 68.0 -421.5 -148.5 -227.8 858.3 1232 864.7 845.5 804.8
Net profit
110.0 56.9 -381.5 -124.8 -277.6 37.80 1024 587.5 589.4 517.3
Adjusted net profit
1.600 31.61 54.79 -1.933 -277.5 42.97 1036 625.3 468.5 466.0
Depreciation
3.500 10.70 39.60 42.50 37.70 214.6 307.6 375.4 401.4 399.1
Finance cost*
2.900 15.60 99.40 64.20 39.20 207.9 95.60 159.9 171.9 160.0
Current assets
773.5 694.3 1,921 1,267 3,064 4,447 4,189 6,255 3,630 3,698
Current liabilities
66.30 1286 659.3 278.4 810.9 1,426 1,401 1,452 1,447 1,542
Fixed assets
25.40 519.7 805.6 1,499 4,538 5,333 6,230 6,198 6,095 5,809
Return on equity (%)
0.123 2.362 1.612 -0.071 -6.712 0.841 16.89 9.433 6.383 6.302
Total Debt*
0 1,437 1,146 1,309 3,751 3,512 3,153 5,016 4,534 4,012
Total Asset
1,383 3,490 5,298 4,719 9,058 9,988 10,621 1,2986 10,506 10,065
3rd quarter S$ mln
30/9/15 30/9/14
Sales
636
645
Pretax profit
97.9
161.1
Net profit
37.2
97.4
Finance cost
44.2
39.4
Depreciation
71.9 98.2
Cash & cash
equivalents
4,566 3,697
Figure 1 Segment Breakdown
B
| Stock Selections
14
Capital Dynamics Sdn Bhd
The week of 21 January – 27 January 2016
Volume 27 Number 21