


 11 / 24

This week, we are not talking
about forecasts. This issue
of
i
Capital is talking about
facts; facts that have not been
highlighted or reported or
analysed in the media. From a
risk management standpoint,
it is important to get all the
facts. The above figures are
telling us that something is
wrong with the US economy.
This development is very
worrisome as investors and
regulators and governments
are not prepared for such a
negative outcome. As
i
Capital
thought aloud last week, a
plunge in the Dow Jones
Industrial Average to 6,000
would have catastrophic
consequences. It would
make the collapse of Lehman
Brothers in Sep 2008 look like
a Sunday picnic. The stock
market plunging now is only
the beginning of 2015-2017
Chapter Two of the US-led
global financial crisis. The
economic impact will follow
suit in the coming months. For
the economy, 2016 and 2017
will be terrible. Remember,
i
Capital is forecasting
a L-shaped economic
environment. How long will the
horizontal line be ? How many
years ?
i
Capital retains its
outlook of the KLSE at a
range of 1,500 to 1,700 for
the
immediate-term
. See
Stop Press for the latest.
For the
short-term
,
i
Capital
retains its bearish outlook at
a range of 1,400 to 1,700.
The
medium-term
outlook
of
i
Capital is retained with
a possible bearish target
range of 800-900.
i
Capital
still expects the KLCI to drop
below 1,000 points for its
long-term
outlook.
and the bearish Shanghai
stock market, we already
have many other indicators
telling us that the bad times
are already here; namely,
Russell 2000, NASDAQ,
Transportation, SOX, Apple
and more. The markets
plunging are not due to the
slower economic growth
seen in China. This is pretty
old news. Oh ya, we forgot
to mention that Italian bank
shares have also crashed.
Unicredit, Italy’s largest bank
by market capitalisation,
has crashed 42% since its
mid-2015 high –
figure 11
.
And Unicredit is not the only
Italian banking stock to crash.
Are we then going to have a
new Eurozone crisis soon ?
The KLSE
Last week,
i
Capital and
Tan Teng Boo shared many of
its uniquely bearish forecasts.
“As
i
Capital has previously
advised, falling oil price should be
a boon for the transport stocks.
Yet, the Dow Jones Transportation
Average has been plunging since
the end of 2014. From the end
of 2014 to now, the Dow Jones
Transportation Average has
already plunged 30%”
“Last week,
i
Capital and Tan Teng
Boo shared many of its uniquely
bearish forecasts. This week, we
are not talking about forecasts.
This issue of
i
Capital is talking
about facts; facts that have not
been highlighted or reported or
analysed in the media. From a
risk management standpoint, it is
important to get all the facts. The
above figures are telling us that
something is wrong with the US
economy.”
in a bear market ?
As
i
Capital has previously
advised, falling oil price
should be a boon for the
transport stocks. Yet, the Dow
Jones Transportation Average
has been plunging since the
end of 2014. From the end of
2014 to now, the Dow Jones
Transportation Average has
already plunged 30% -
figure
7
. If this is not a bear market,
then, we do not know what
is. Yet, you do not read this
bearish development in the
Western media headlines or
the analyst reports. A bearish
Dow Jones Transportation
Average has very negative
messages for the global
economy. This index peaked
in end-2014/early 2015. This
means that the deterioration
at the global economy level
will be seen in 2016. Fasten
your safety belt. And get a
super strong one. So far, the
Dow Jones Transportation
Average has plunged almost
the same number of points as
it did in 2008-2009.
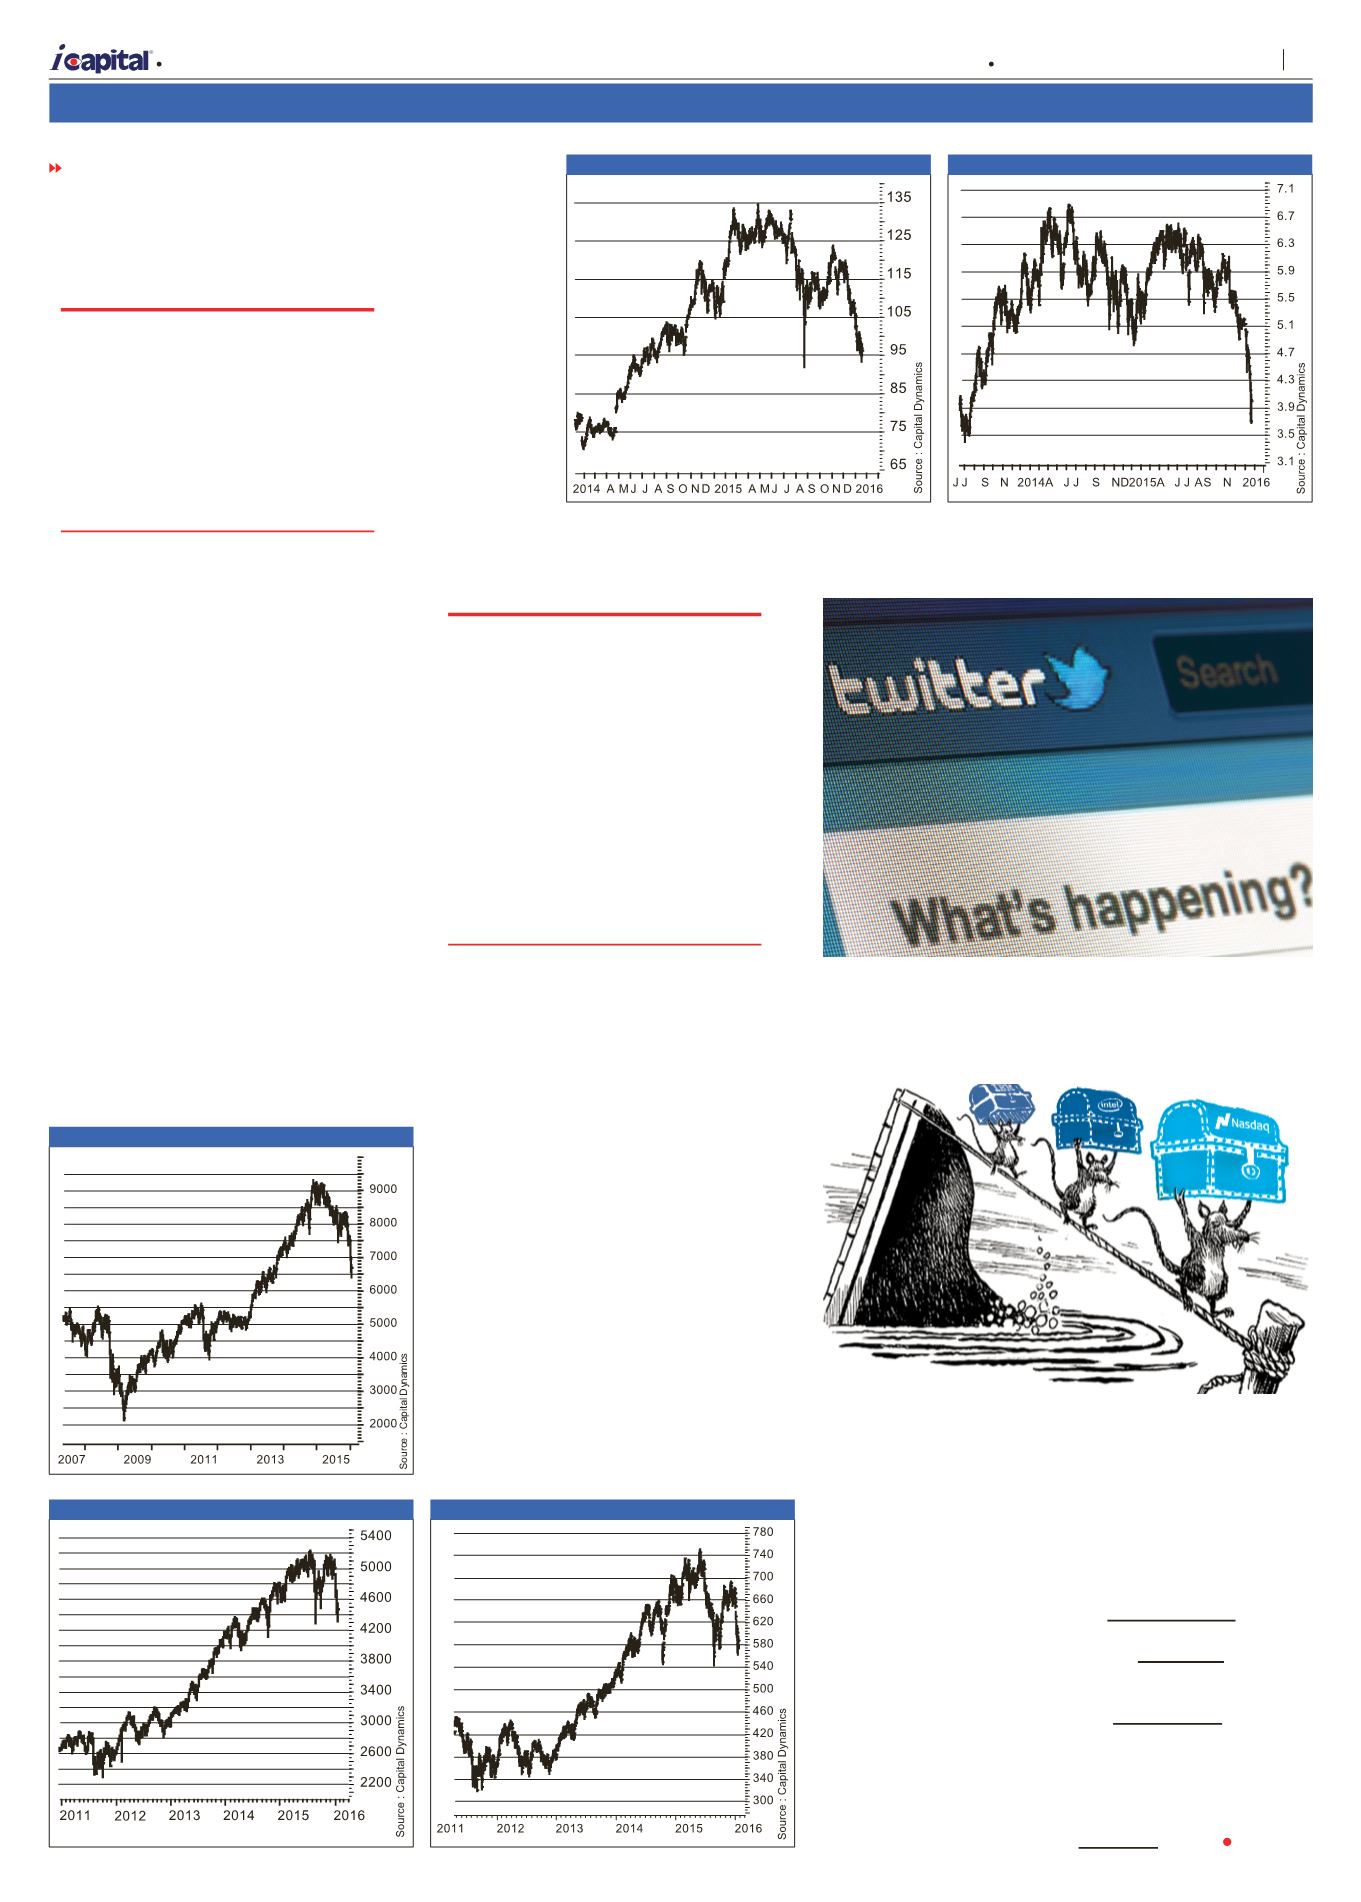
The bear market is not
confined only to the Russell
2000 or the transportation
stocks. Even the technology
rich NASDAQ has been
faltering – see
figure 8
.
The technology sectors are
supposed to be innovative,
full of new products
and disruptive
technologies. So
far, the plunge is a
bit short of a 20%
bear market but
other technology
indicators have
already gone to
bear territory. The
message is that the
NASDAQ still has
a long way to fall. It is not just
“old” technology stocks like
Intel or IBM; the
falls are across
the board.
Even Twitter
is struggling to
survive.
Figure 9
below shows
the SOX or the
Philadelphia
semiconductor
index. Like the
other indices
shown above,
it is already
trapped by
the bears. No
wonder, this
fact has been unreported or
not highlighted.
Figure 10
is
even more interesting. Apple
Inc, the company that many
touted to be the 1st trillion
dollar company has also
been snared by the hungry
bears. It is no
fun reporting
rotten apple.
Even suppliers
to Apple
like Analog
Devices have
plunged.
So, the
truth of the
matter is that
besides the
plunging oil
price, the
supposed
crash of
China’s
economy,
Source:
www.shutterstock.comSource:
drugmonkey.scientopia.orgFROM PAGE 10
Figure 7 DJ Transportation Average
Figure 8 NASDAQ
Figure 9 SOX
Figure 10 Apple Inc
Figure 11 UniCredit S.p.A.
A
| Market Opinion
11
Capital Dynamics Sdn Bhd
The week of 21 January – 27 January 2016
Volume 27 Number 21