


 6 / 24

Source:
www.shutterstock.comLooking for a job ?
recession soon follows. What
happens when inflation is low
or non-existent ? How can the
yield curve become inverted
in such an environment as
the longer-term interest rates
cannot be lower than zero or
near zero short-term interest
rates.
If it cannot invert, then,
how can this apparently
reliable
leading
indicator
function in a
deflationary
environment
? We need
to turn to
other leading
indicators.
The stock
market
index like
the S&P500
is a classic
one. Then,
analysts also
monitor the
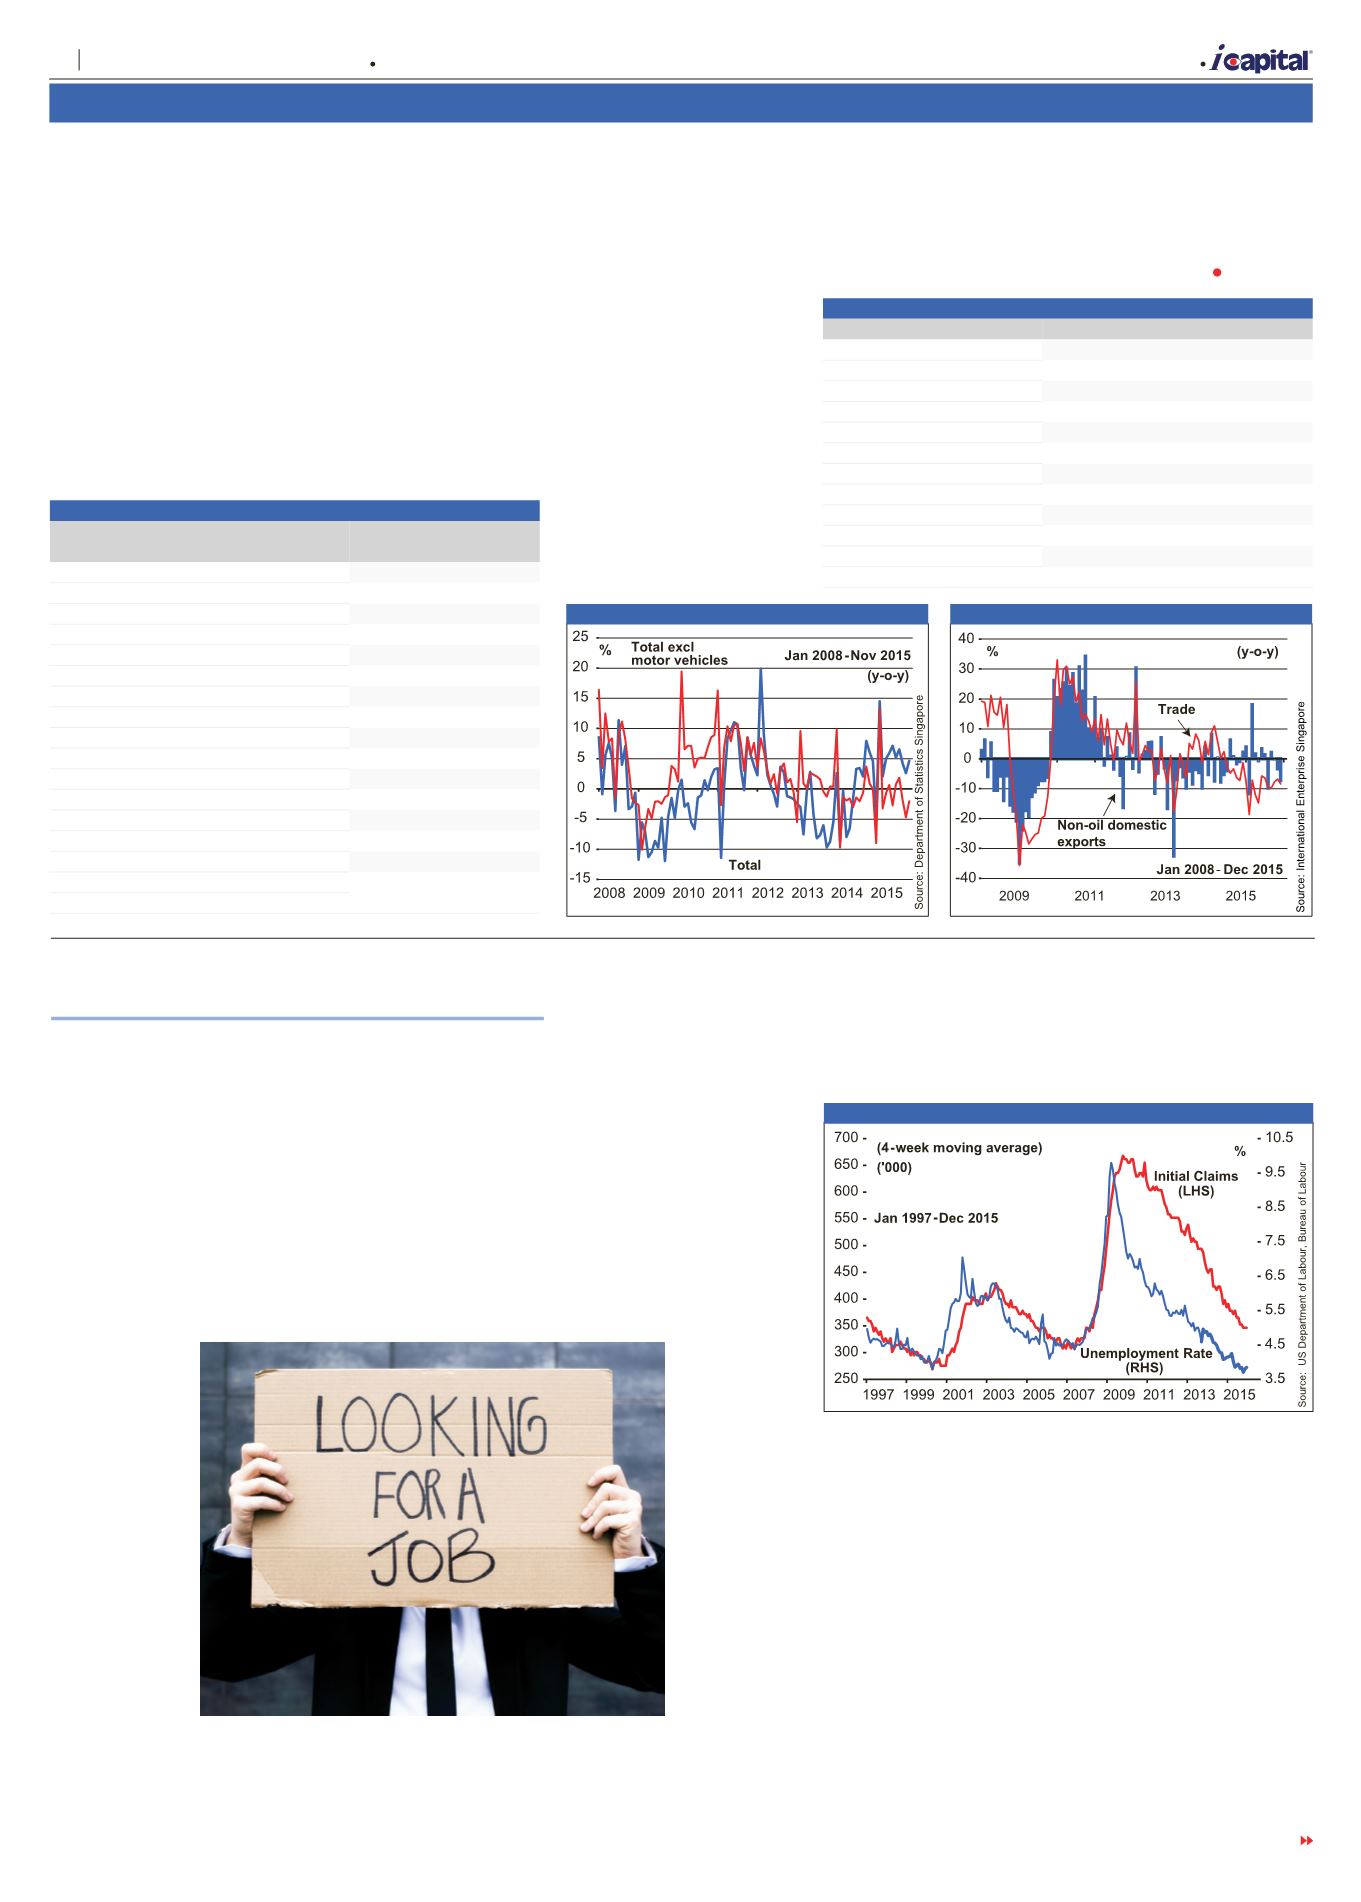
weekly initial
job claims.
Figure 1
displays
the 4-week moving average
of the weekly initial claims
and layered upon it is the
The NYSE rally is certainly
ageing, if it is not already in
the start of a severe bearish
phase. At the same time, the
economic recovery is ageing
too, with many indicators
flashing warning signs. The
US manufacturing sector is
already in a contractionary
state, for example. That
corporate earnings are falling
is another
example. Hence,
is the sharp,
unexpected
market sell-off
in Jan 2016 a
sign that the
US economy is
heading for a
recession ?
At the same
time, many
classic signs of
an impending
recession are
not present
yet. The yield
curve, an
indicator which
is very popularly
tracked and
deemed to be
reliable, is not flashing red
yet. The Federal Reserve
has so far only raised a
measly 25 basis points, not
enough to invert the yield
curve. However,
i
Capital
has a question to ask about
the role of the yield curve in
a deflationary environment.
In an inflationary state, the
Federal Reserve increases
the short-term interest rate to
such an extent that it becomes
higher than the longer-term
interest rates. In the monetary
tightening process, the yield
curve becomes inverted and a
A.2. International Perspectives
New York
Retail sales
Seasonally adjusted,
retail sales in Nov gained
1.4% from Oct. Excluding
motor vehicles, they rose
by 1.9% – see
table 12
.
Year-on-year, retail sales rose
by 4.7%. The increase was
again mainly due to motor
vehicle sales, which surged
by 59.7% in Nov. Excluding
motor vehicles, retail sales
contracted by 2.0% from a
year ago – see
figure 22
.
External trade
Year-on-year, total trade
slipped by 8.4% in Dec as
exports and imports fell by
6.4% and 10.6% respectively.
Non-oil domestic exports
(NODX) declined by 7.2%
in Dec, after a 3.4% fall in
the preceding month – see
figure 23
. Electronic NODX
slipped by 0.3% in Dec,
while non-electronic NODX
contracted by 10.3% in Dec
from the previous year – see
table 13
. Meanwhile, non-oil
re-exports (NORX) inched
up by 0.8%, year-on-year,
in Dec, with an expansion
in non-electronic NORX
outweighting the contraction
in electronic NORX.
NODX to the top 10 NODX
markets, with the exception
of the US, Japan and Hong
Kong, declined in Dec. China,
South Korea and Taiwan
were the main contributors
Singapore
to the decline of NODX.
NODX to the emerging
markets also contracted by
10.0%, year-on-year, in Dec,
extending the 2.4% fall in the
preceding month.
unemployment rate. The
weekly claims typically rise
in advance of a recession. At
the moment, the claims have
not risen convincingly yet but
one needs to watch it closely
for major turning points.
Claims have been below
the 300,000 mark, which
is associated with strong
labour market conditions,
for 46 straight weeks, the
longest streak since the
early 1970s. For the latest
week ended 16 Jan 2016,
the number of Americans
filing for unemployment
benefits rose to a six-month
high, suggesting some loss
of momentum in the US
labour market. Initial claims
for state unemployment
benefits increased 10,000 to a
seasonally adjusted 293,000,
the highest reading since early
Jul 2015.
For analysts to dismiss
the occurrence of a 2016
US recession amidst the
surprising, nasty NYSE
and NASDAQ plunge is
too rash. The Russell 2000
Index, sensitive to domestic
US economic conditions, is
already in a bear market; the
same is seen for the Dow
Jones Transportation Average
and bellwether stocks like
Apple. Subscribers of
i
Capital
are advised to track the
Table 12 Retail Sales (% change)
From Oct
2015
From Nov
2014
Total
1.4
4.7
Total (excl motor vehicles)
1.9
-2.0
Department stores
3.5
1.3
Supermarkets
-0.7
-1.0
Mini-marts & convenience stores
-1.7
-5.1
Food & beverages
-1.1
-11.4
Motor vehicles
-0.6
59.7
Petrol service stations
0.4
-15.8
Medical goods & toiletries
-2.1
9.6
Wearing apparel & footwear
1.6
-0.5
Furniture & household equipment
3.6
-0.8
Recreational goods
2.4
-6.9
Watches & jewellery
9.4
-2.2
Telecommunications apparatus & computers
-5.1
-8.2
Optical goods & books
2.2
-6.8
Others
2.0
2.7
Source: Department of Statistics Singapore
Table 13 NODX (y-o-y % change)
Oct 2015 Nov 2015 Dec 2015
Total
0.0
-3.4
-7.2
Electronic products
-3.2
0.6
-0.3
Disk drives
-2.3
-26.1
-22.0
PCB assembled
-12.2
-10.2
-13.0
Integrated circuits
-7.4
-3.5
-11.3
Telecommunications equipment
42.3
41.4
45.6
Consumer electronics
10.2
-9.3
17.6
Non-electronic products
1.4
-5.1
-10.3
Total chemicals
10.2
-5.4
-14.1
Pharmaceuticals
44.6
-12.5
-9.9
Petrochemicals
-9.0
-4.0
-17.5
Source: International Enterprise Singapore
Figure 22 Retail Sales
Figure 23 Trade and NODX
TURN TO PAGE 7
Figure 1 Initial Claims for Unemployment and Unemployment Rate
A
| Market Opinion
6
Capital Dynamics Sdn Bhd
The week of 21 January – 27 January 2016
Volume 27 Number 21