


 5 / 24

Australia
Housing finance
In seasonally adjusted
terms, the total value of
dwelling finance commitments
in Nov grew by 1.8% from
Oct. Investment housing
commitments edged up by
0.7%, while owner-occupied
housing commitments rose
by 2.4% from the preceding
month – see
table 8
.
Year-on-year, the total
value of owner-occupied
housing commitments
jumped by 25.8%, while the
total value of investment
housing commitments fell by
7.7% – see
figure 18
. Going
forward, investment housing
commitments are expected
to continue declining. This
is because all the four major
banks have increased interest
rates for mortgage loans to
cover additional costs arising
from more capital being set
aside to meet regulatory
requirements.
Lending finance
Seasonally adjusted, the
total value of lending finance
commitments in Nov rose by
1.3% from the previous month,
mainly due to gains in owner-
occupied housing finance
and commercial finance
commitments – see
table 9
.
Year-on-year, personal
finance was the only sector
that reported a decline in Nov.
Meanwhile, owner-occupied
housing finance gained 30.1%
in Nov, while commercial
finance commitments
expanded by 28.3% – see
figure 19
.
New motor vehicle sales
In Dec, the sales of new
motor vehicles slipped 0.5%
from Nov in seasonally
adjusted terms, with sports
utility and other vehicle sales
dropping by 1.0% and 6.2%
respectively – see
table 10
. In
trend terms, the sales of motor
vehicles decreased by 0.1%
month-on-month. Year-on-
year, new motor vehicle sales
continued to grow in Dec, but
at a slower pace of 2.2% – see
figure 20
. The increase in car
sales was again due mainly to
the gain in sports utility vehicle
sales.
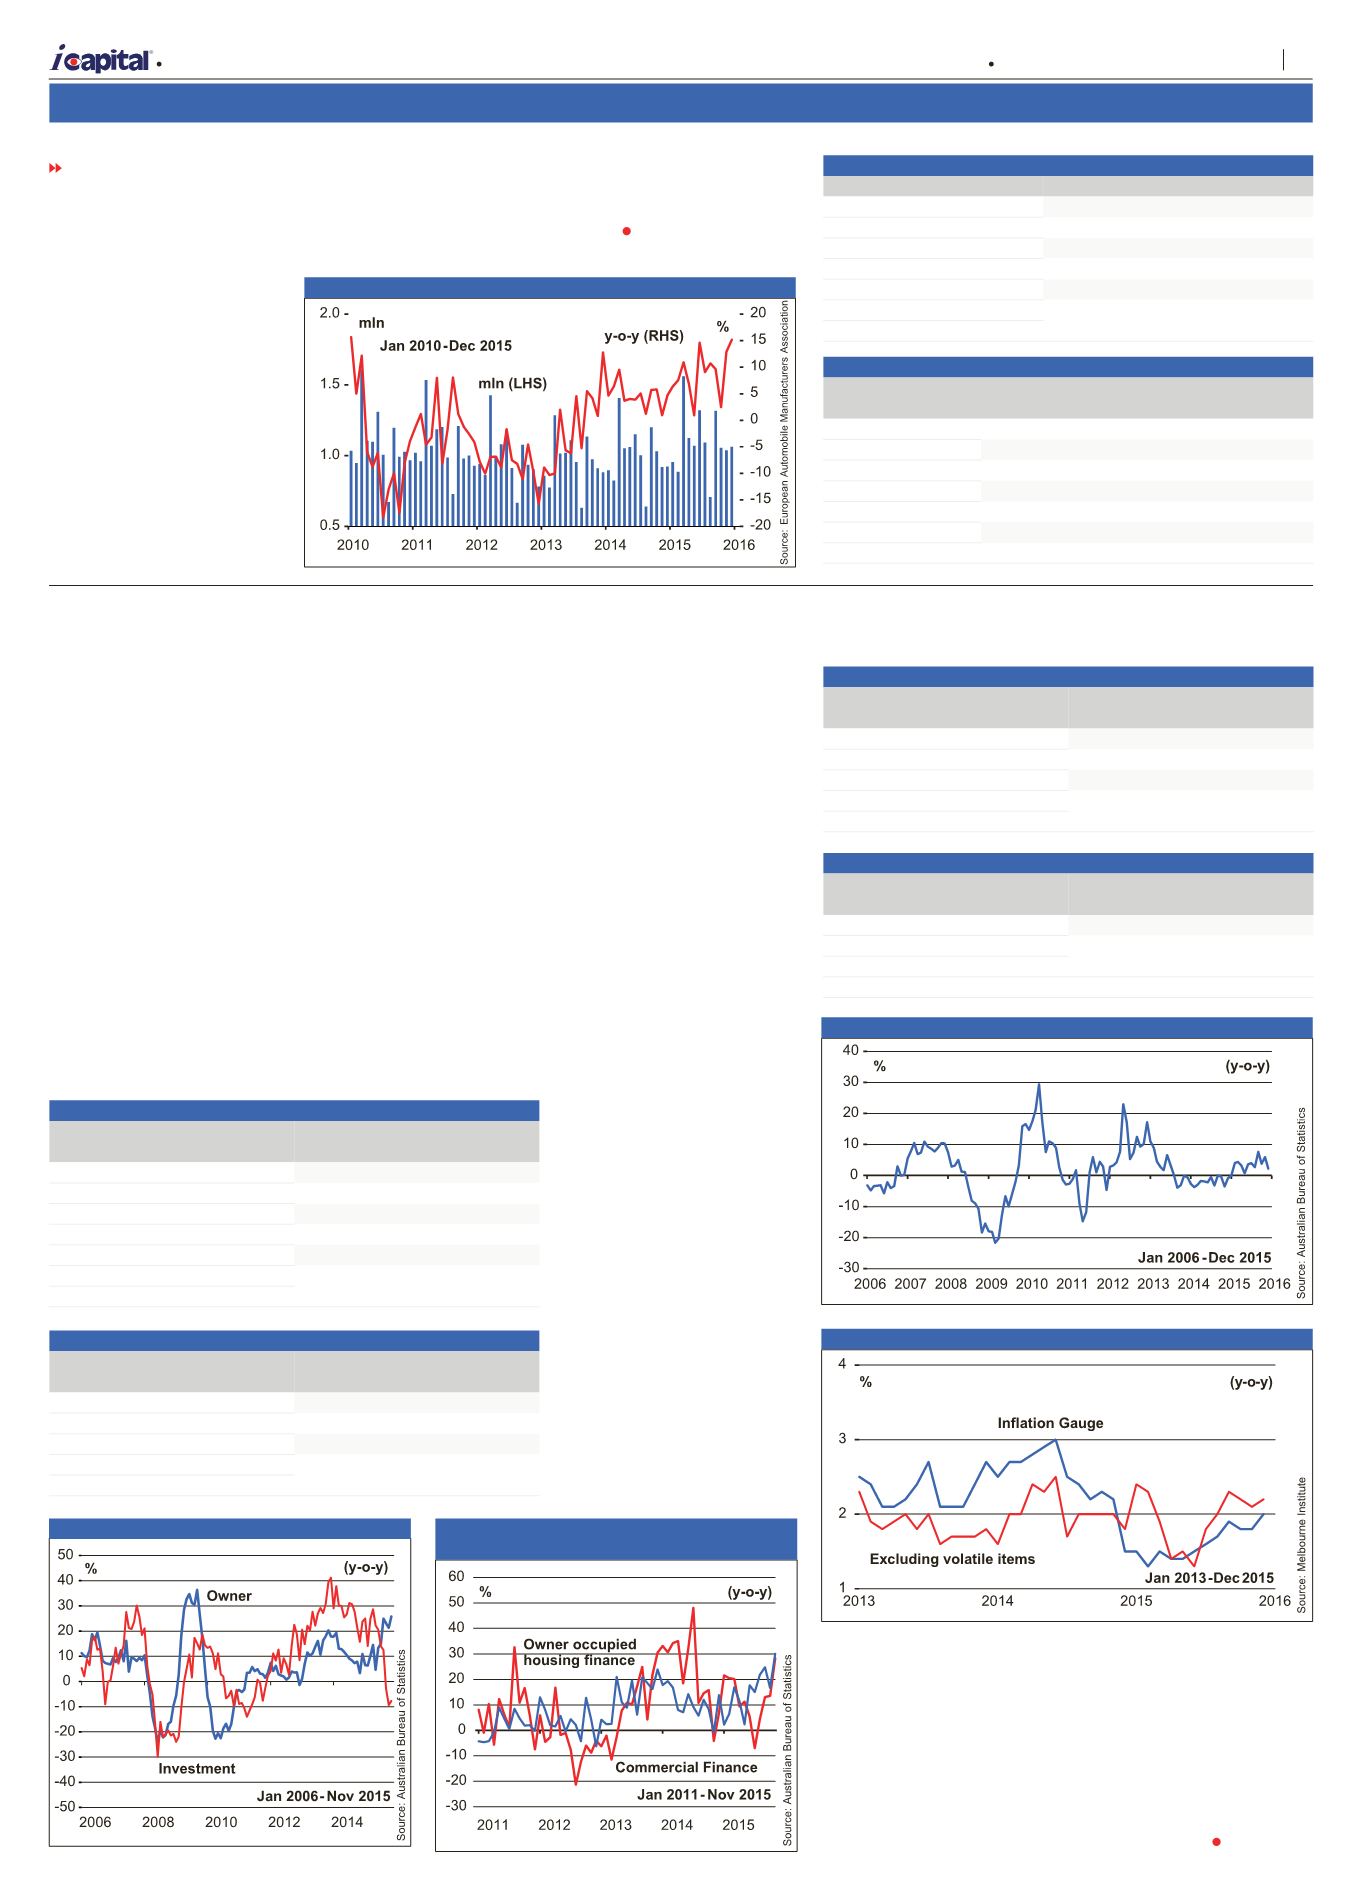
Inflation gauge
The inflation gauge in Dec
inched up by 0.2% from the
previous month. Excluding
volatile items, the inflation
gauge grew by 0.3% – see
table 11
. Over the twelve
months to Dec, the inflation
gauge increased by 2.0%,
at the lower bound of the
Reserve Bank of Australia’s
2-3% inflation target band.
Core inflation gauge (excluding
volatile items) rose by 2.2%,
year-on-year – see
figure 21
.
Price increases in fruits
and vegetables, holiday
travel & accommodation,
and meat & seafood were
the main contributors to
inflation. However, these
were partially offset by price
falls in fuel, non-alcoholic
beverages and rents. Going
forward, inflationary pressure
is expected to remain subdued
given low energy prices and
weak domestic and global
economic growth.
persistent fall in oil price.
Car sales
In Dec, new passenger
car registrations in Western
Europe surged, year-on-year,
for the 28th consecutive
month at a faster pace of
15.2% – see
figure 17
. All
of the five major countries
continued to register
growth, with Spain, Italy and
France leading by double-
digit increments in Dec.
Meanwhile, on a month-on-
month basis, new passenger
car sales also rose by 2.4%
FROM PAGE 4
– see
table 7
.
In Jan-Dec 2015,
cumulative new car sales
rose by 8.9% from the same
period last year. Going
forward, new car sales are
expected to continue its
upward trend in the coming
months.
Figure 17 New Passenger Car Registrations
Table 6 Annual Inflation Rate (%)
Oct 2015 Nov 2015 Dec 2015
All items
0.1
0.1
0.2
Energy
-8.5
-7.3
-5.8
All-items excluding energy
1.2
1.0
0.9
Food, alcohol & tobacco
1.6
1.5
1.2
Non-energy industrial goods
0.6
0.5
0.5
Services
1.3
1.2
1.1
Source: Eurostat
Table 7 New Passenger Car Registrations
Car registrations Yearly change (units)
Nov 2015 Dec 2015 Nov 2015 Dec 2015
France
150,334 183,720 15,267 20,366
Germany
272,377 247,355 22,295 17,655
Italy
134,021 109,395 25,475 17,196
Spain
81,650 88,609 16,528 15,169
United Kingdom
178,876 180,077
6,549 13,879
Western Europe
1,038,193 1,063,291 118,681 139,971
Source: European Automobile Manufacturers Association
Figure 18 Owner occupied and investment housing
Table 8 Housing Finance (% change)
From Oct
2015
From Nov
2014
Total dwelling commitments
1.8
11.7
Owner-occupied housing
2.4
25.8
Construction
3.5
3.0
Purchase of new dwellings
-3.4
19.4
Purchase of established dwellings
2.0
27.1
Investment housing
0.7
-7.7
Source: Australian Bureau of Statistics
Table 9 Lending Finance (% change)
From Oct
2015
From Nov
2014
Owner-occupied housing finance
2.4
30.1
Personal finance
0.9
-3.4
Commercial finance
1.1
28.3
Lease finance
-3.9
14.6
Source: Australian Bureau of Statistics
Table 10 New motor vehicle sales (% change)
From Nov
2015
From Dec
2014
Total Vehicles
-0.5
2.2
Passenger vehicles
2.7
-2.0
Sports utility vehicles
-1.0
13.4
Other vehicles
-6.2
-5.7
Source: Australian Bureau of Statistics
Table 11 Inflation Gauge (% change)
From Nov
2015
From Dec
2014
Total
0.2
2.0
Excluding volatile items*
0.3
2.2
* Volatile items are automotive fuel, fruits, and vegetables
Source: Melbourne Institute
Figure 20 New motor vehicle sales
Figure 21 Inflation Gauge
Figure 19 Commercial and Owner Occupied
Housing Finance Commitments
A
| Market Opinion
5
Capital Dynamics Sdn Bhd
The week of 21 January – 27 January 2016
Volume 27 Number 21