


 2 / 24

Date to be expected (Date in parentheses is actual release date).
Economic Calendar
Malaysia
Note from Publisher :
In a belated move, the International Monetary Fund (IMF) cut its world economic
growth outlook for 2016 in its latest World Economic Outlook. Even after the downward
revision, the forecast still appears to be too optimistic. Given Tan Teng Boo’s global
financial crisis Chapter 2 scenario, this will not likely be the IMF’s last downward
revision. There will be more downward revisions. As we write elsewhere in this issue,
there are nervous conflicting signals emanating from the US economy and they
deserved to be closely monitored. After all, the US economy is still the largest in the
world.
For a vast majority of people, a global depression is unimaginable; after all, the last one
happened more than 80 years ago and those who are old enough to have experienced
the sufferings and pain are dead. However, as depicted in last week’s
i
Capital, the
consequences are devastating, painful and scary. Mind you, so far, we have only
touched on the economic aspects of a depression. The scenario would be even more
heart wrenching if the social and political facets are taken into account. The purpose of
discussing the gloomy scenario is not to frighten our subscribers but to help them be
prepared for possibly the worst economic crisis they will ever face, especially if one is
below the age of 40-45 years old.
For the coming Chinese New Year,
i
Capital will not be published in the first two weeks
of Feb 2016. The first issue in the year of the Monkey will be Volume 27, number
23, dated 18-24 Feb, 2016. However, during this period, our investment portal,
www.icapital.bizwill be updated as usual and apart from the public holidays, our office’s
operating hours will not be affected.
Low Guat Meng,
Executive Director
A.1 Economic Fundamentals
United States
Producer price index
In Dec, the seasonally
adjusted producer price index
(PPI) for final demand fell
by 0.2% from Nov. This was
mainly due to a sharp decline
in energy prices – see
table 2
.
Excluding foods and energy,
the core PPI rose by 0.1%
from the previous month. On
Consumer price index
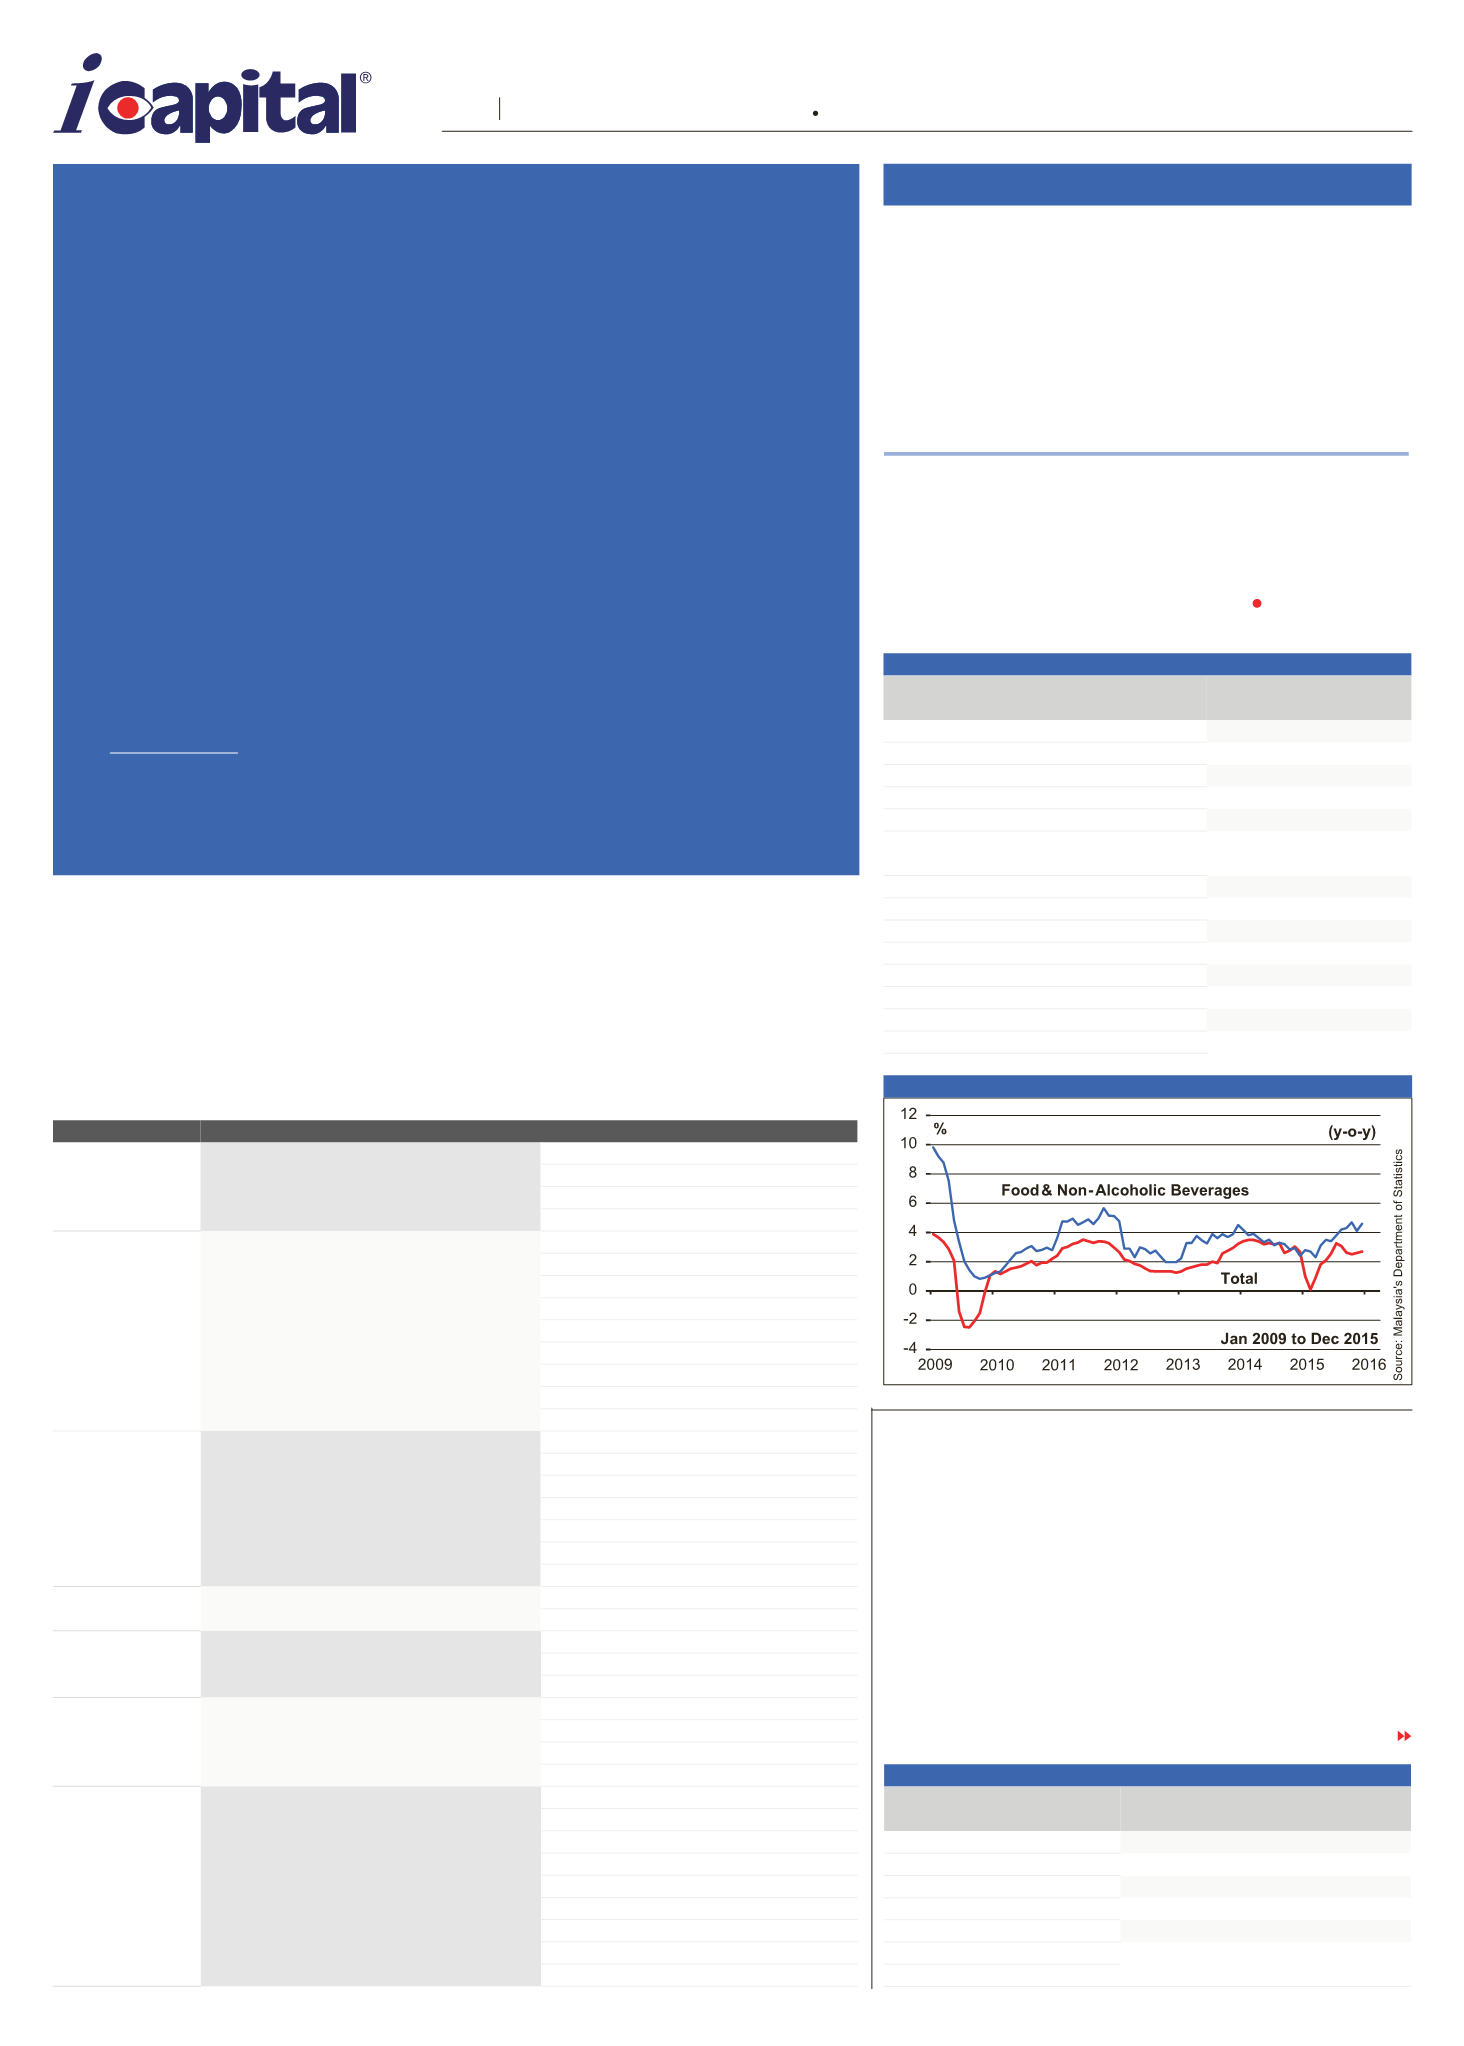
In Dec, the consumer price
index (CPI) remained stable
on a month-on-month basis,
but rose 2.7%, year-on-year
– see
figure 1
. The rise in
inflation rate was again mainly
due to a surge in tobacco
prices – see
table 1
. In
Jan-Dec 2015, the CPI rose
by 2.1% from the same period
a year ago.
a year-on-year (y-o-y) basis,
the headline PPI fell by 1.0%,
making for the 11th consecutive
month of y-o-y decline, while
the core PPI rose by 0.3%
– see
figure 2
. Inflationary
pressures remain weak amidst
a strong US$, low oil prices,
and weak global demand.
TURN TO PAGE 3
Figure 1 Consumer Price Index
Table 1 Consumer Price Index (% change)
From Nov
2015
From
Dec 2014
Total
0.0
2.7
Food & non-alcoholic beverages
0.7
4.6
Alcoholic beverages & tobacco
1.7
22.8
Clothing & footwear
-0.1
0.8
Housing, water, electricity, gas & other fuels
0.0
2.5
Furnishings, household equipment, & routine
household maintenance
0.1
4.2
Health
0.3
4.6
Transport
-2.3
-6.2
Communication
-0.1
3.3
Recreation services & culture
0.0
2.6
Education
0.3
2.6
Restaurants & hotels
0.2
4.7
Miscellaneous goods & services
-0.2
5.4
Source: Department of Statistics Malaysia
Jan 25 – Jan 31
Feb 01 – Feb 07
Malaysia
(25 Jan) Nov leading index
Dec external trade
(29 Jan) Dec producer price index
(29 Jan) Dec money supply
(29 Jan) Dec bank lending
US
(26 Jan) Jan consumer confidence index
Jan ISM manufacturing index
(27 Jan) FOMC meeting
Dec personal income
(27 Jan) Dec new home sales
Dec consumer spending
(28 Jan) 23 Jan initial claims
Jan auto sales
(28 Jan) Dec durable goods orders
Jan ISM non-manufacturing index
(29 Jan) 4Q 2015 GDP (advance)
30 Jan initial claims
(29 Jan) 4Q 2015 employment cost index
4Q productivity
Jan employment report
Dec trade balance
Japan
(25 Jan) Dec external trade
Jan auto sales
(28 Jan) Dec retail sales
(29 Jan) Dec industrial production
(29 Jan) Dec employment report
(29 Jan) Dec household spending
(29 Jan) Dec consumer price index
(N/A) Dec housing starts
China
Jan manufacturing PMI
Jan non-manufacturing PMI
Europe
(29 Jan) Dec money supply, M3
Dec unemployment
Dec industrial producer price index
Dec retail trade
Singapore
(25 Jan) Dec consumer price index
(26 Jan) Dec industrial production
(28 Jan) 4Q labour market (preliminary)
(29 Jan) Dec trade price indices
Australia
(27 Jan) 4Q consumer price index
Jan index of commodity prices
(29 Jan) 4Q 2015 producer price index
Jan inflation gauge
(29 Jan) Dec private credit
Jan performance of manufacturing index
(29 Jan) Dec money supply
Interest rate
Dec external trade
Dec building approvals
Jan performance of services index
Dec retail sales
Jan performance of construction index
Table 2 Producer Price Index (% change from prior month)
Oct
2015
Nov
2015
Dec
2015
Total final demand
-0.4
0.3
-0.2
Final demand goods
-0.4
-0.1
-0.7
Excluding foods and energy
-0.3
-0.1
0.1
Foods
-0.8
0.3
-1.3
Energy
0.0
-0.6
-3.4
Final demand services
-0.3
0.5
0.1
Source: Bureau of Labour Statistics
This section is based on a top-down/market-timing approach. In each issue of
i
Capital®,
Capital Dynamics will look at the major economic variables, locally and abroad, major
equity markets plus some technical indicators before reaching its conclusion for the
KLSE Composite Index. In other words, Section A should be read in toto.
A
| Market Opinion
2
Intelligence
Independence
Integrity
Capital Dynamics Sdn Bhd
Definitions:
Immediate-term :
next few weeks.
Short-term :
up to 7/8 months.
Medium-term :
up to 2/3 years.
Long-term :
beyond 3 years.
The week of 21 January – 27 January 2016 Volume 27 Number 21