


 3 / 24

Consumer price index
The headline CPI in Dec
fell 0.1% from the previous
month. Excluding the food and
energy components, the core
CPI edged up by 0.1%, the
smallest increase since Aug
2015 – see
table 3
. Year-on-
year, the headline CPI rose
by 0.7%, while the core CPI
gained 2.1% – see
figure 3
.
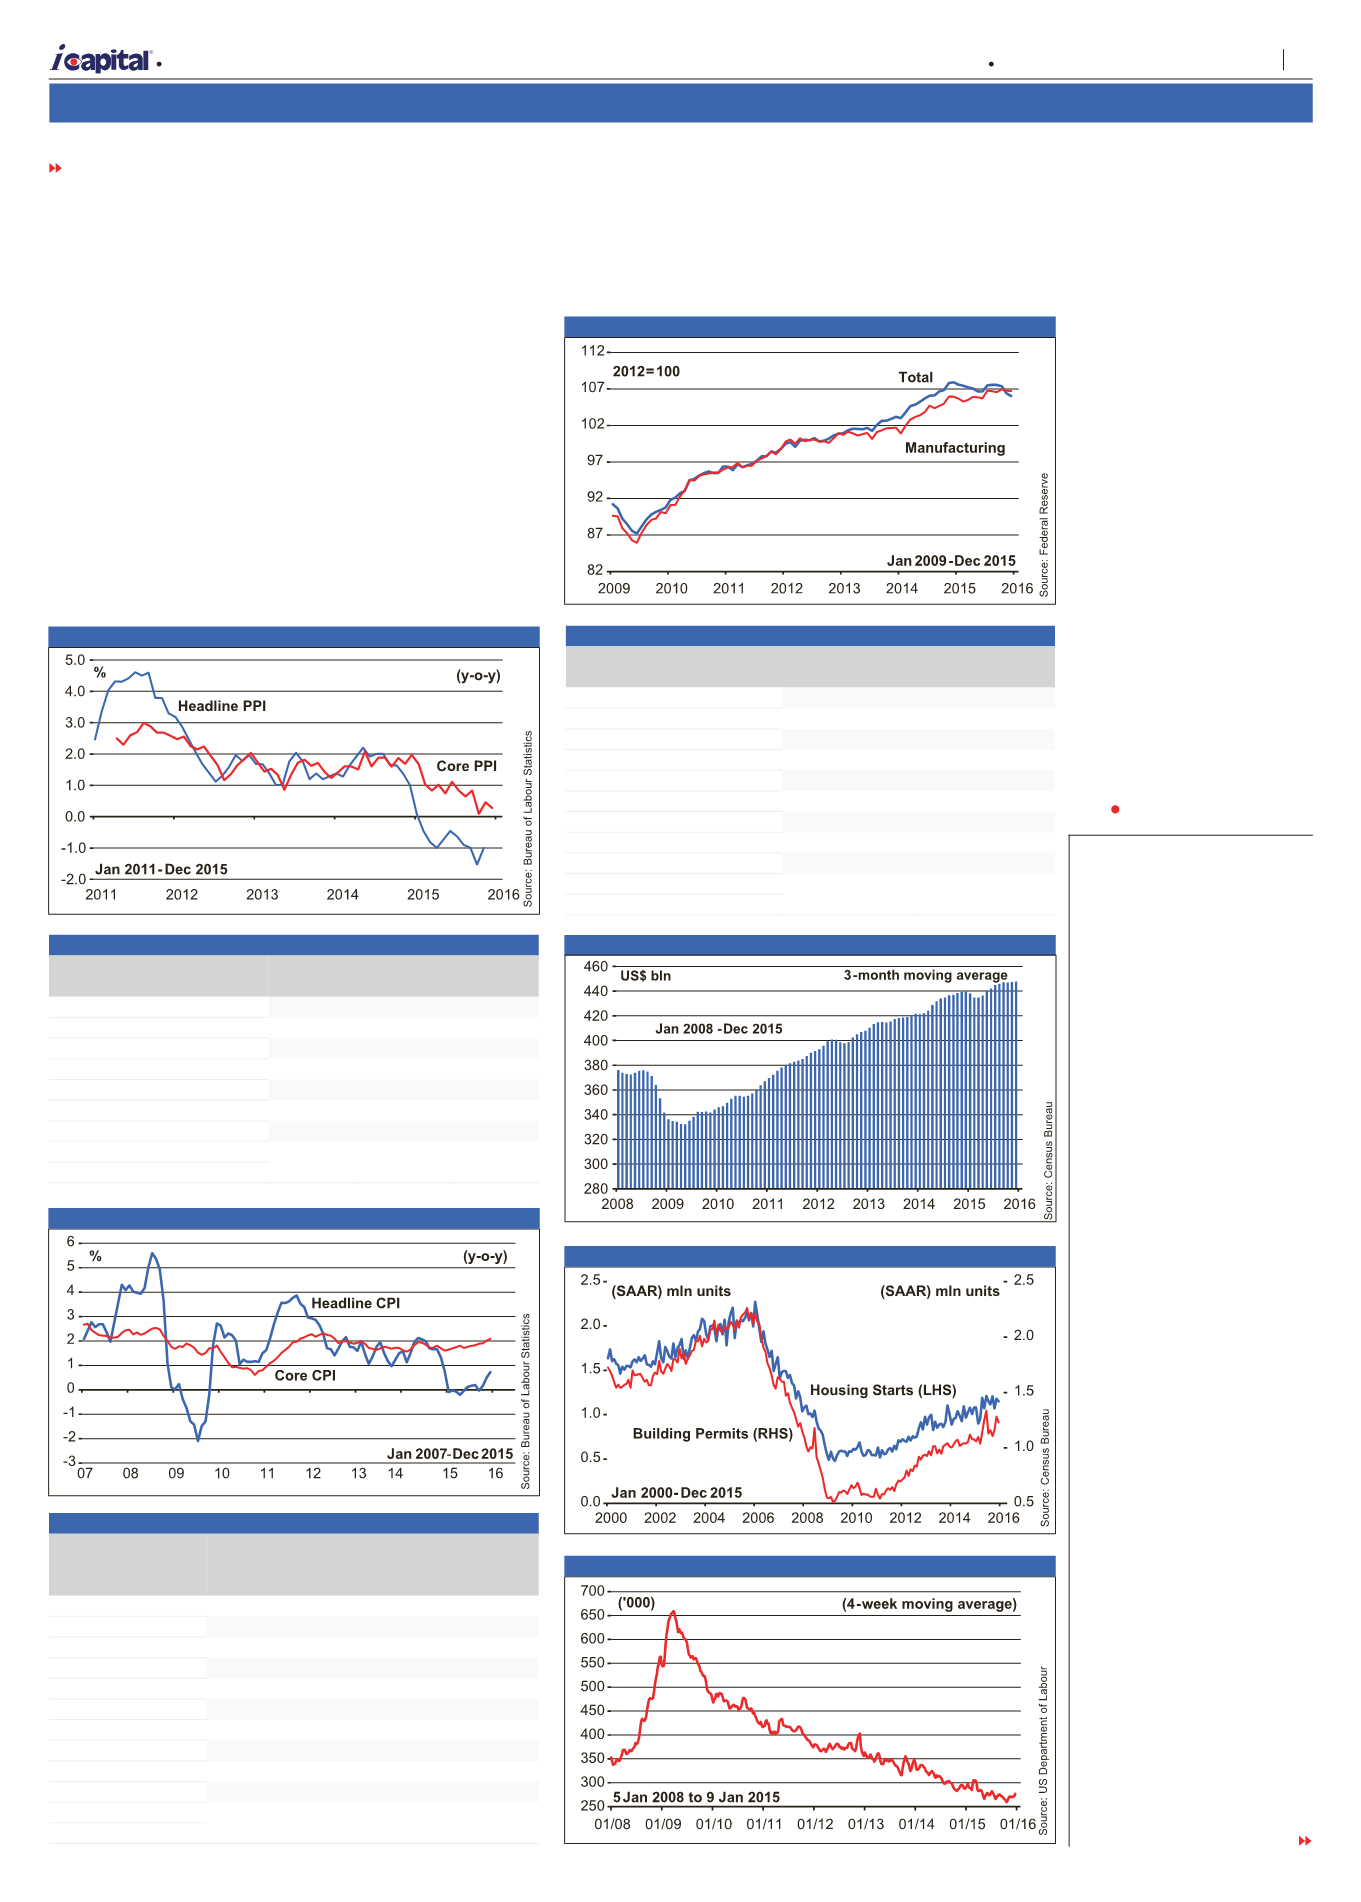
Industrial production
In Dec, industrial
production fell by 0.4% from
Nov. Industrial production has
been falling consecutively for
the third month as a result
of lower utilities output – see
table 4
. The overall industry
capacity utilisation rate also
declined from 76. 9% in
Nov to 76.5% in Dec. On a
year-on-year basis, industrial
production fell by 1.8%.
The moderation reflects the
effect of unseasonably warm
weather, a strong US$ and low
oil prices – see
figure 4
.
Retail sales
In Dec, retail sales fell by
0.1%, month-on-month, mainly
due to a decline in sales at
gasoline stations and an
unseasonably warm weather –
see
table 5
. On a year-on-
year basis, retail sales rose by
2.2% – see
figure 5
.
China
GDP
China’s real GDP in 4Q
2015 rose 6.8%, year-on-
year – see
figure 8
. Growth
was sustained mainly by firm
private consumption amidst
falling exports and slowing
investment activities. For
the whole of 2015, China’s
economy grew 6.9% from
2014, the first below 7%
growth since 1990, but was
in line with the government’s
target of around 7%. Given
the fluid conditions at the
moment,
i
Capital’s forecast
for China’s real GDP growth
in 2016 is in a wide range of
4.5-6.5%.
Industrial production
In Dec, industrial
production rose by 5.9%,
year-on-year. The slower
growth rate was mainly due
to a 3.7% contraction in
electricity output, which in
turn was affected by a warmer
weather condition. Given the
weak new orders received,
manufacturing activity
would still face considerable
downward pressure going
forward – see
figure 9
.
In 2015, industrial output
rose by 6.1% from 2014.
Retail sales
In Dec, retail sales rose
by 11.1% from a year ago.
FROM PAGE 2
Housing starts
Housing starts in Dec fell
2.5%, month-on-month, but
rose 6.4%, year-on-year, to a
seasonally adjusted annual
rate (SAAR) of 1.149 mln
units. Housing starts have
exceeded 1 mln units for
the 9th consecutive month,
the longest stretch since Apr
2008 – see
figure 6
. The
number of single-family and
multi-family housing units
under construction fell 3.3%
and 3.4%, month-on-month,
respectively. Year-on-year,
single-family housing starts
increased 6.1% to a SAAR
of 768,000 units, while
multi-family housing starts
increased 8.6% to 365,000
units. Meanwhile, building
permits, an indication of future
activity, fell 3.9% from Nov, but
rose 14.4% from a year ago to
a SAAR of 1.232 mln units.
Initial claims
The seasonally adjusted
initial claims for the week
ending 9 Jan 2016 were
284,000, up 7,000 from the
previous week. The 4-week
moving average increase
by 3,000 from the previous
week to 278,750 – see
figure
7
. Continuing jobless claims
for the week ending 2 Jan
2016 registered a seasonally
adjusted 2.263 mln, up 29,000
from the previous week; the
4-week moving average
increased by 5,250 to 2.224
mln.
TURN TO PAGE 4
Table 3 Consumer Price Index (% change from the prior month)
Oct
2015
Nov
2015
Dec
2015
All Items
0.2
0.0
-0.1
All items less food and energy
0.2
0.2
0.1
Energy
0.3
-1.3
-2.4
Food
0.1
-0.1
-0.2
Apparel
-0.8
-0.3
-0.2
Shelter
0.3
0.2
0.2
Transportation
0.2
0.6
0.3
Medical care
0.8
0.4
0.1
Source: Bureau of Labour Statistics
Table 4 Industrial Production
% change from
the prior month
% change
from
Oct 2015 Nov 2015 Dec 2015 Dec 2014
Total industry
-0.2
-0.9
-0.4
-1.8
Major market groups
Final products
-0.3
-0.7
-0.5
-1.2
Consumer goods
-0.2
-0.6
-0.8
0.3
Business equipment
-0.4
-1.0
0.1
-0.8
Construction
2.2
0.0
0.6
1.6
Materials
-0.5
-1.2
-0.3
-3.1
Major industry groups
Manufacturing
0.4
-0.1
-0.1
0.8
Mining
-2.0
-2.1
-0.8
-11.2
Utilities
-1.8
-5.0
-2.0
-6.9
Source: Federal Reserve
Table 5 Retail Sales (% change)
Change from
prior month
Change from
prior year
Total
-0.1
2.2
Ex-auto & parts
-0.1
1.2
Motor vehicles & parts
0.0
6.1
Furniture & home furniture
0.9
6.0
Electronics & appliance
-0.2
-3.8
Food & beverages
-0.3
1.2
Health & personal care
0.2
3.6
Gasoline stations
-1.1
-14.6
Clothing & clothing accessories
-0.9
0.6
General merchandise
-1.0
0.1
Source: Census Bureau
Figure 2 Producer Price Index
Figure 3 Consumer Price Index
Figure 4 Industrial Production Index
Figure 6 Housing Starts and Building Permits
Figure 7 Initial Claims
Figure 5 Retail Sales
A
| Market Opinion
3
Capital Dynamics Sdn Bhd
The week of 21 January – 27 January 2016
Volume 27 Number 21