


 10 / 24

growth have also been well
telegraphed and intended.
Otherwise, how to rebalance
China’s economy ? We all
knew these for years; the
Western media knew these
for years.
What is surprising is that
the stable
economic
growth in
China in
the last few
years has
instead been
interpreted and
reported in
the media and
analyst reports
as China’s
economy
crashing
and heading
for a major
crisis. As an
independent
and objective
investment
adviser, Capital
Dynamics
sees this type
of reporting
and analysis
as wrong,
worrying and
dangerous.
i
Capital needs
to protect
and project
the truth. As
the plunge in
oil price and
China’s stock
market still
dominate the headlines and
the reports, one needs to
look at the other unreported
developments. For example,
the Russell 2000 Index is
already in a bear market (see
figure 6
).
The Russell
2000 Index is a
small-cap stock
market index of
the bottom 2,000
stocks in the Russell
3000 Index. The
S&P 500 index is
used primarily for
large capitalisation
stocks. The Russell
2000 Index is the most
widely quoted measure of
the overall performance of
the small-cap to mid-cap
shares. American small-caps
are an excellent way to
China have been
weak as far back
as 2012-2013,
thanks partly to
a super strong
Renminbi, which
China did not
complain at all
and a weak
global economy.
Figures 1 to 3 tell
us that the latest
supposed “weak”
economic data
from China is
nothing new. We
all knew this for
years; the Western
media knew this for years. So,
why such a ruckus now ?
What have been weak are
industrial production (
figure
4
) and fixed asset investment
(
figure 5
). Both have been
climbing down steadily since
2013. Well, what do you
know ? These declines in
So far, the
media
headlines
are still mainly
dominated by
falling crude
oil price, the
supposed
troubled China
economy and
crashing stock
market. The
plunge in crude
oil price is
certainly worthy
of very close
attention. For
one, substantial
movements in
oil price always have major
global implications. Two,
except for a very few people
like Tan Teng Boo, very few
foresaw, as early as he did,
oil price crashing to below
US$30. So, it is not surprising
for the plunging oil price to
capture the headlines. The
same cannot be said for the
current slowdown in China’s
economy though.
Why ? For one thing, the
economic slowdown in China
has been going on for years.
It is the most telegraphed,
the most intended, and the
most well planned economic
slowdown in the history of
mankind. The leaders from
China have been saying the
same message for years.
Figure 1
shows China’s GDP
growth since 2012. It was
already at the 7-8% range.
What is the big deal about
6.9% now ? Why make such
a big fuss ? You
all knew it was
coming, and it
came. The same
can be said for
China’s retail
sales.
Figure
2
is adjusted
for inflation and
what do you
know ? Real
retail sales have
been growing
in the low teens
for years. Ha, exports, you
say exports have been falling
and China desperately needs
to weaken the Renminbi to
be competitive. Again,
figure
3
tells us that exports from
avoid the adverse effects
of international tensions as
well as to avoid the negative
impact of a strong US$ on
corporate earnings. A much
smaller proportion of revenues
from American small-cap
companies are generated
abroad relative to the
large-cap companies, which
make up the S&P 500. If
China and the falling oil price
are adversely affecting the
global stock markets, why is
it that the Russell 2000 Index
is performing worse than the
S&P 500 ? Why is it that the
Russell 2000 Index is already
“If China and the falling oil
price are adversely affecting
the global stock markets, why
is it that the Russell 2000 Index
is performing worse than the
S&P 500 ? Why is it that the
Russell 2000 Index is already in
a bear market ?”
“For one thing, the economic
slowdown in China has been
going on for years. It is the most
telegraphed, the most intended,
and the most well planned
economic slowdown in the history
of mankind. The leaders from
China have been saying the same
message for years”
A.4. KLSE Conclusion
PROJECTING THE TRUTH
Source: Capital Dynamics
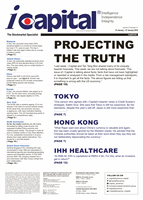
Occupy Wall Street in 2011. Will it
repeat soon ?
TURN TO PAGE 11
KLSE Composite Index : Market Valuation
21 Jan 2016 14 Jan 2016 15 Jan 2015
PE Ratio
17.56 17.89 16.69
Div Yield
3.15
3.09
3.38
Price/Bk Value
1.75
1.79
2.11
FBM KLCI
1,600.92 1,633.44 1,745.00
Source: Bursa Malaysia, Capital Dynamics
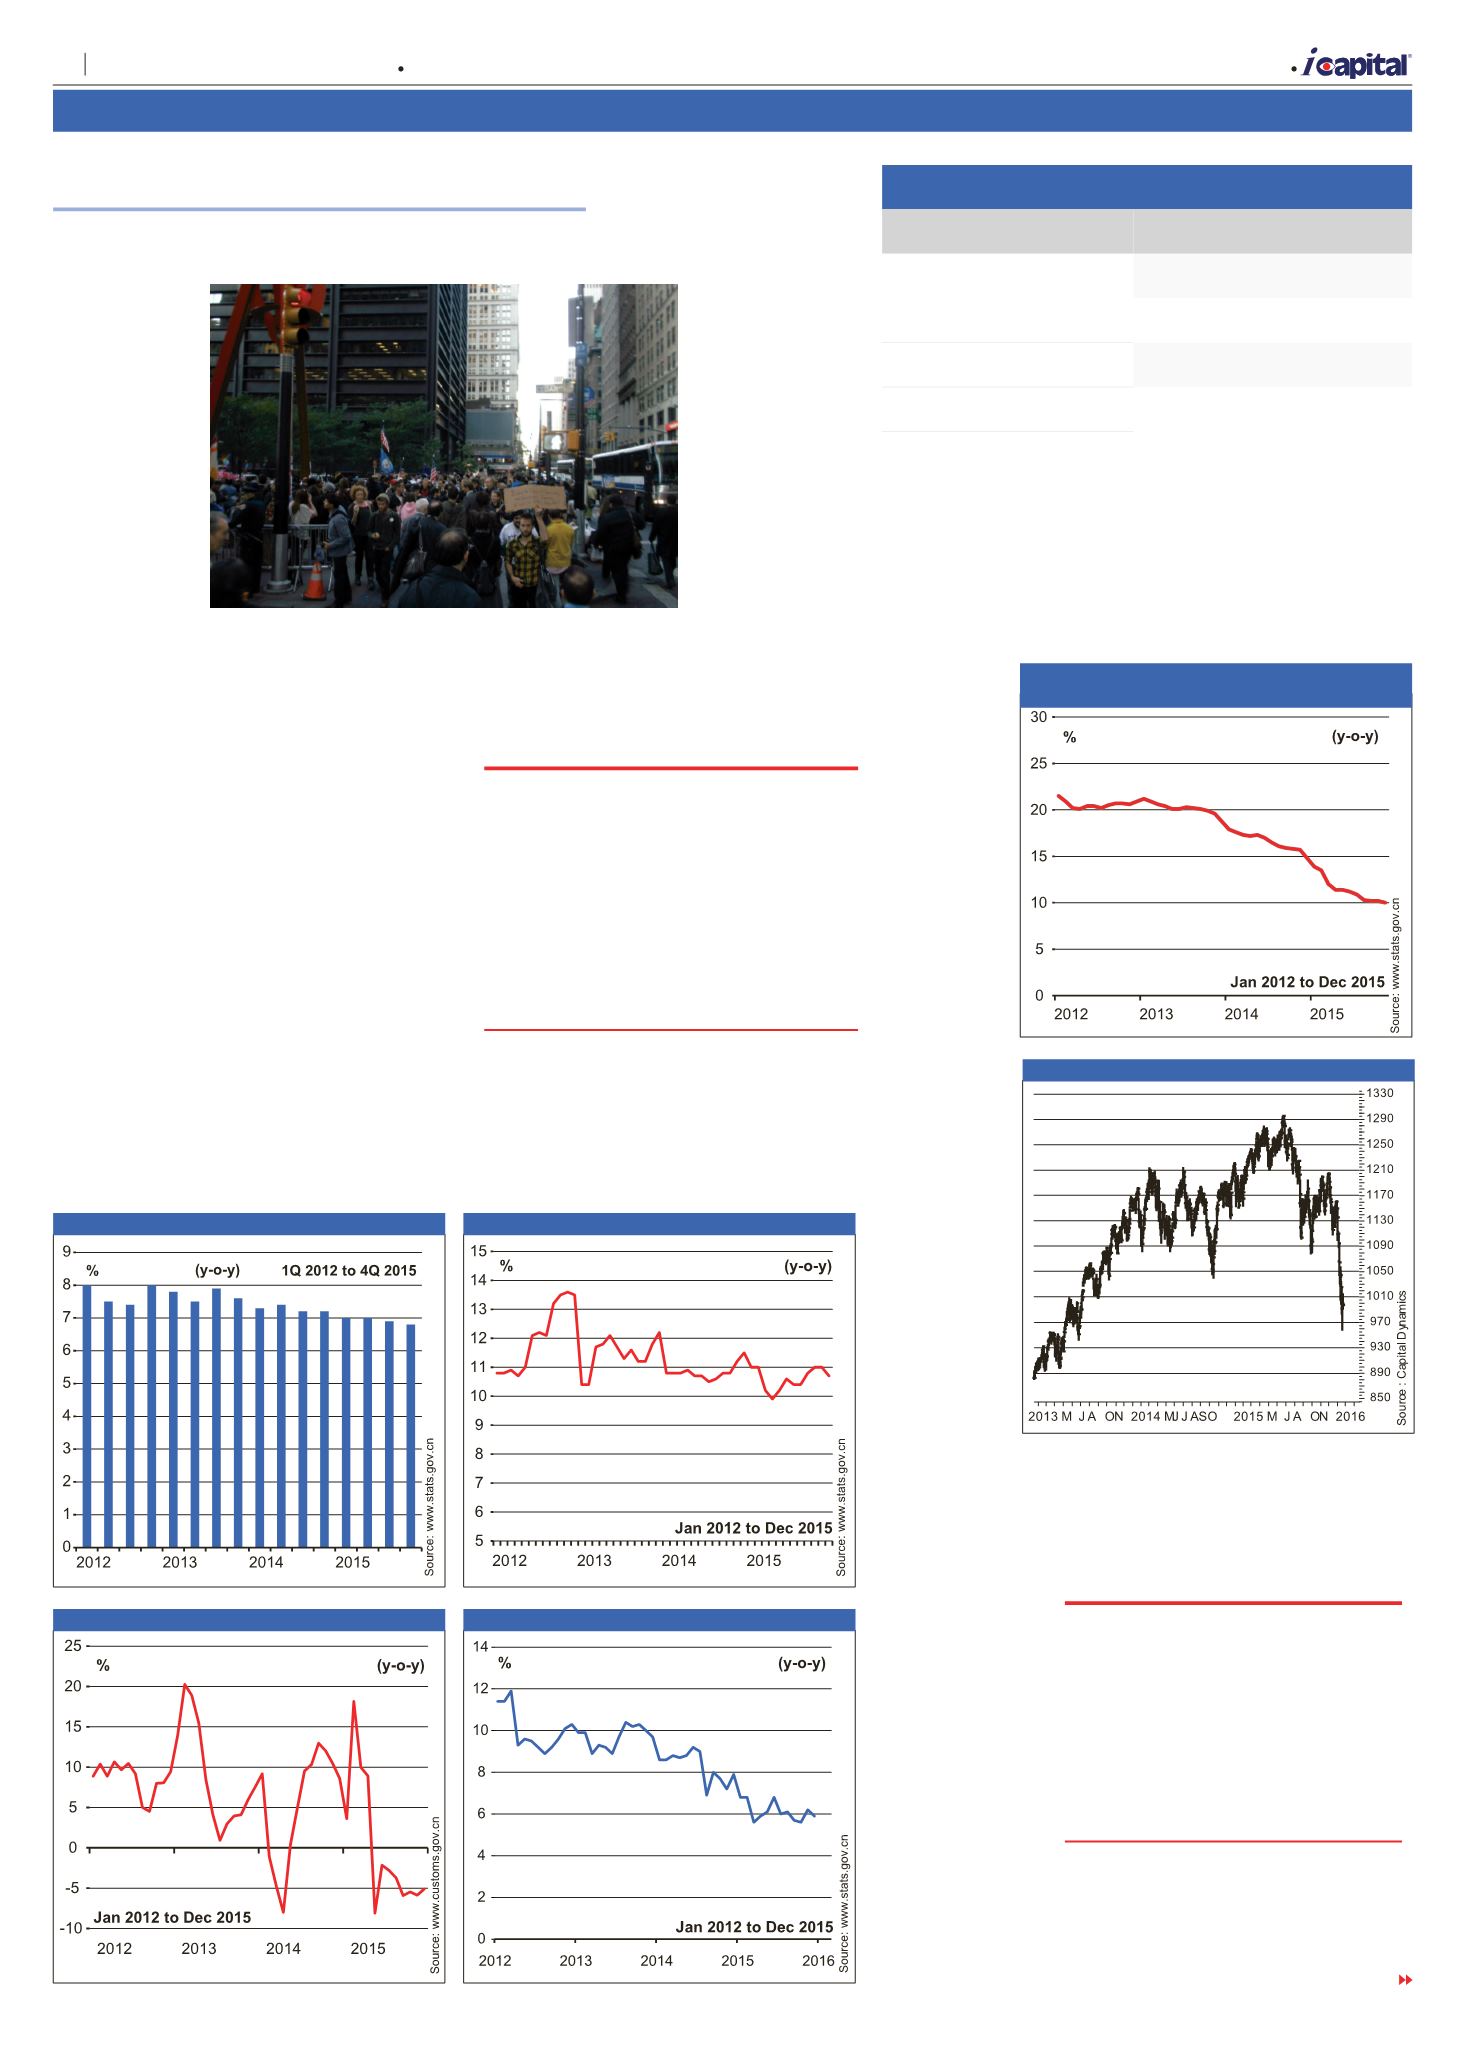
Figure 5 Cumulative Fixed Asset Investment
(Excluding rural households)
Figure 6 Russell 2000 Index
Figure 4 Industrial Production
Figure 2 Real Retail Sales
Figure 3 China’s Exports (3-months moving average in US$)
Figure 1 China’s Real GDP
A
| Market Opinion
10
Capital Dynamics Sdn Bhd
The week of 21 January – 27 January 2016
Volume 27 Number 21