


 4 / 24

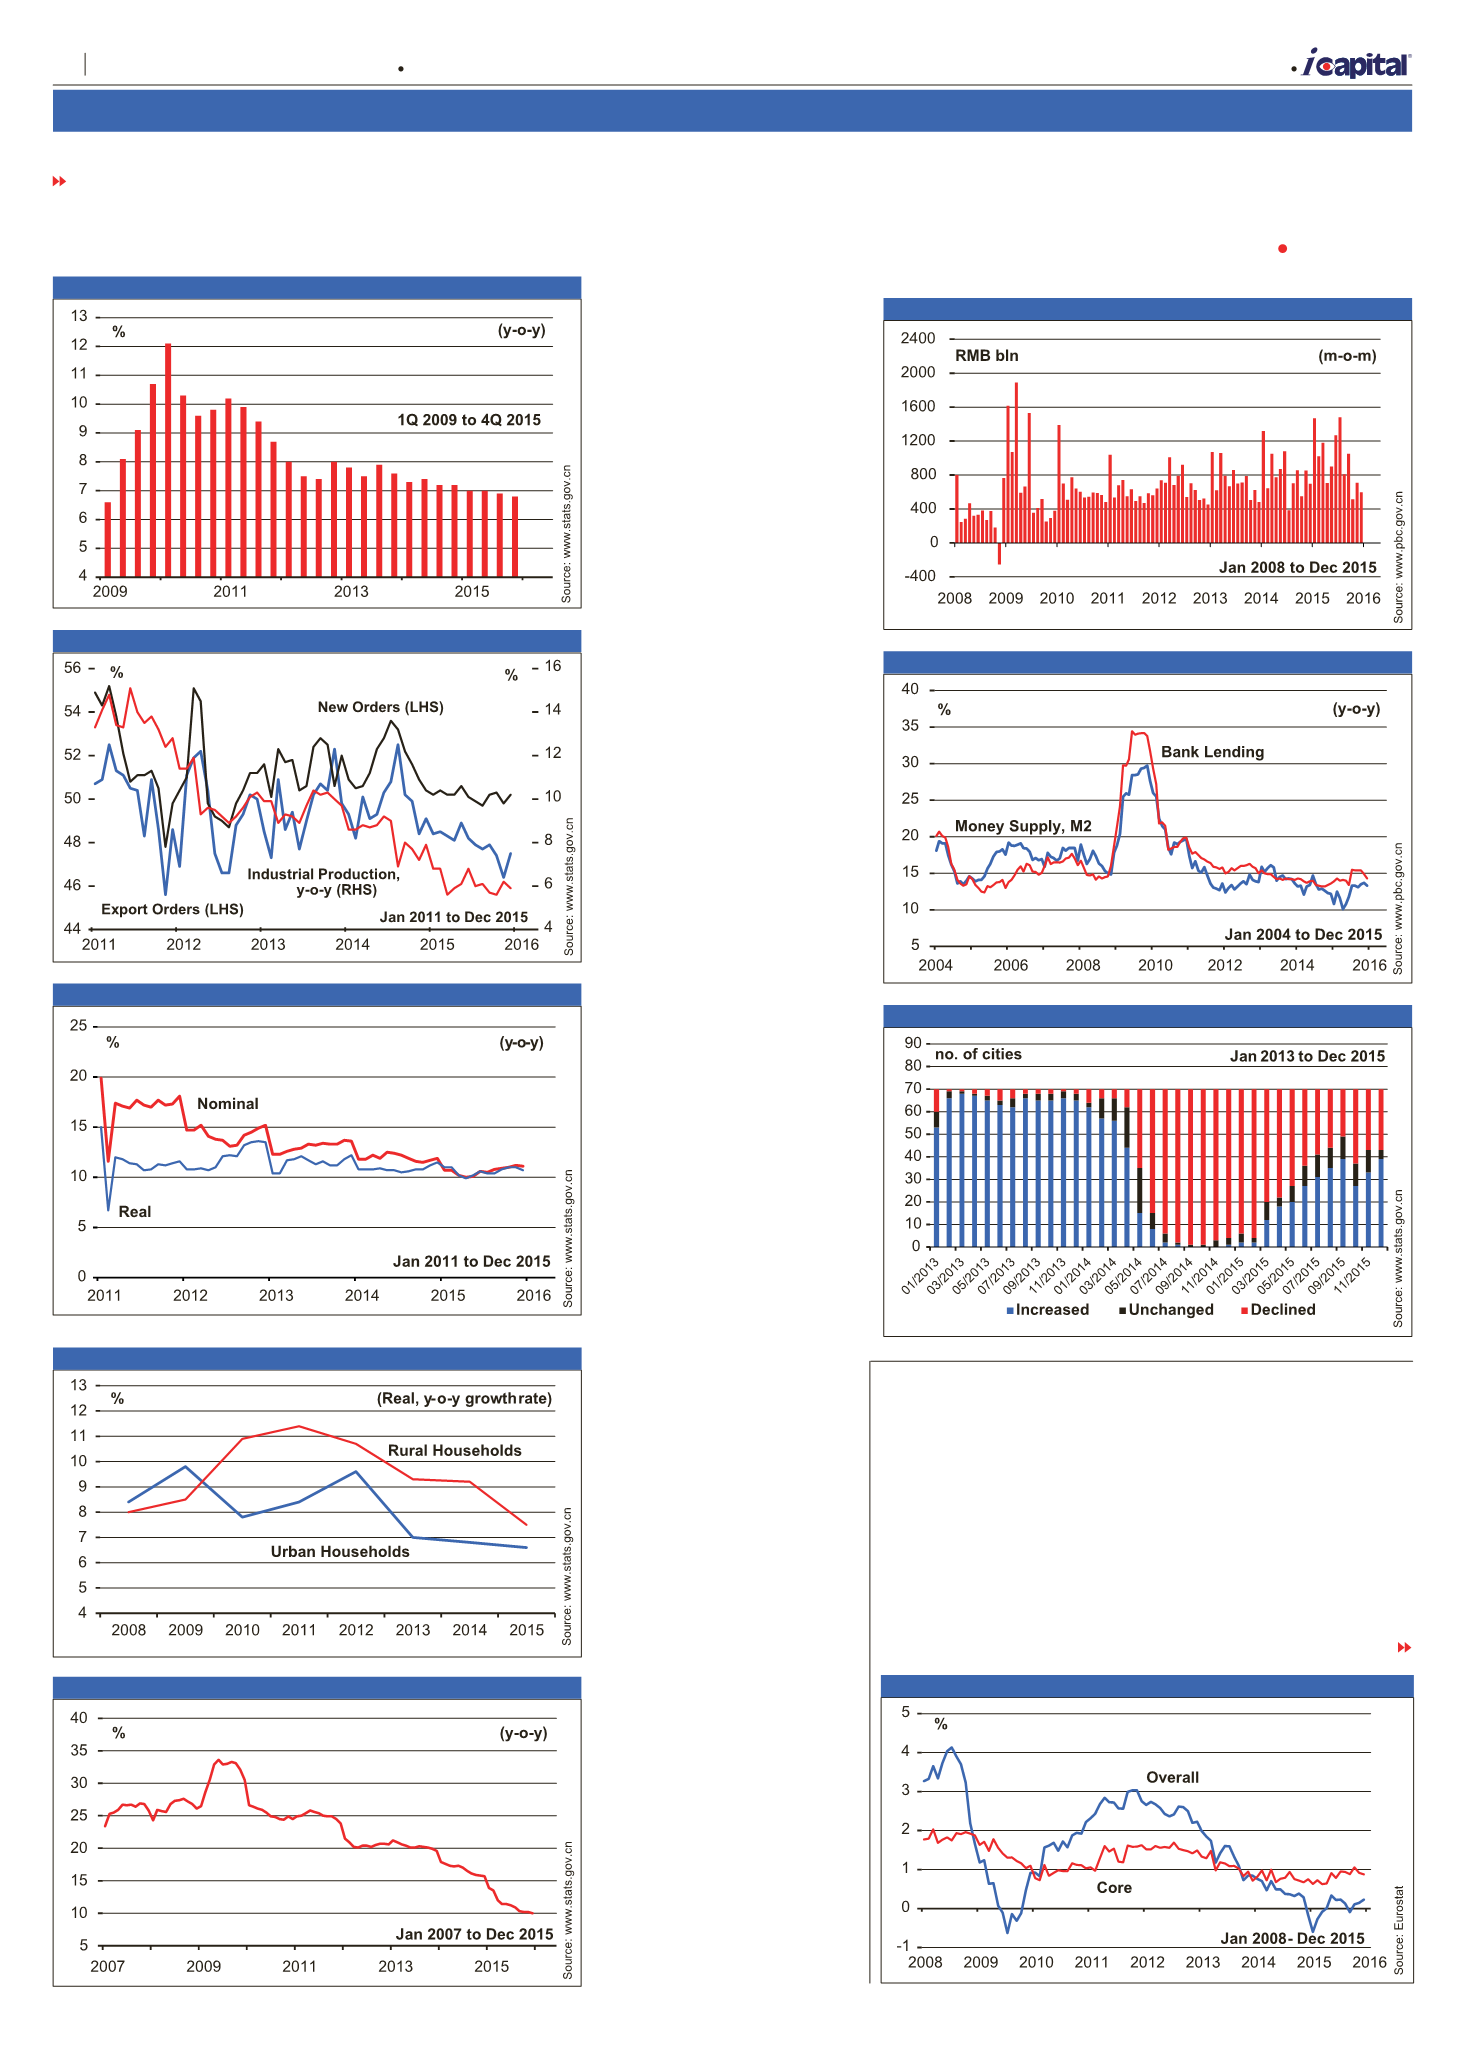
After factoring out the price
factor, real retail sales rose
by 10.7%, year-on-year –
see
figure 10
. The steady
performance in retail sales is
reassuring. Domestic demand
FROM PAGE 3
Inflation
In Dec, the annual inflation
rate edged up to 0.2% – see
figure 16
. On the other hand,
excluding energy, the inflation
rate dipped slightly to 0.9%
– see
table 6
. The higher
cost of restaurants & cafes,
Europe
is still providing stable support
to China’s economy.
In 2015, retail sales rose
by 10.7% from 2014.
Household income
Household income
continued to grow steadily
in 2015, rising 8.9% from
2014. Factoring out the price
effects, household income
grew by 7.4%, faster than
the real GDP growth rate.
Urban household per capita
disposable income rose 8.2%
to RMB31,195, while the per
capita cash income of rural
households expanded 8.9%
to RMB11,422. Factoring out
the price effects, urban and
rural household per capita
income rose 6.6% and 7.5%
respectively. Affected by
falling commodity prices,
rural household income rose
at a substantially slower
pace in 2015. However,
urban household income
growth was relatively stable,
indicating a stable labour
market – see
figure 11
.
Fixed asset investment
Fixed asset investment
(excluding rural households)
in Jan-Dec 2015 rose 10.0%
from the same period a
year ago, slowing from the
10.2% expansion in Jan-Nov
2015 – see
figure 12
. While
industrial excess capacity
is suppressing investment
expenditure, lately, monetary
and fiscal policies have been
supportive for a stronger
investment growth, thus the
downtrend in fixed asset
investment expansion should
stabilise soon.
Bank lending
Renminbi bank loans
outstanding at the end of
Dec were RMB93.95 trillion,
up 14.3% from a year ago.
New bank loans totalling
RMB597.8 bln were created
in Dec. The slowdown in
credit growth reflects slowing
economic activities – see
figure 13
. In 2015, RMB11.72
trillion new bank loans
were created, RMB1.81
trillion more than in 2014, a
moderate increase.
Money supply
The annual growth rate of
money supply, M2, at the end
of Dec slowed to 13.3%. This
reflects slowing economic
activities – see
figure 14
.
House prices
The housing sector
continued to recover in
Dec, especially in the first
tobacco, and vegetables
were again partially offset by
falls in the prices of fuels for
transportation, heating oil,
and gas. Inflationary pressure
is expected to remain weak in
the months ahead due to the
TURN TO PAGE 5
and second tier cities. The
number of cities reporting
month-on-month increases
in house prices rose from 33
in Nov to 39 in Dec, while
the number of cities reporting
declines in house prices
remained unchanged at 27 –
see
figure 15
.
Figure 8 China’s Real GDP
Figure 9 Industrial Production and Manufacturing Orders
Figure 10 Retail Sales
Figure 11 Household Income Per Capita
Figure 12
Cumulative Fixed Asset Investment (Excluding rural house
holds)
Figure 13 Renminbi Bank Loans
Figure 14 Money Supply and Bank Lending
Figure 15 Month-on-month Change in House Prices
Figure 16 Annual Inflation Rate
A
| Market Opinion
4
Capital Dynamics Sdn Bhd
The week of 21 January – 27 January 2016
Volume 27 Number 21