


 9 / 36

The week of 18 August – 24 August 2016
Volume 28 Number 01
A
| Market Opinion
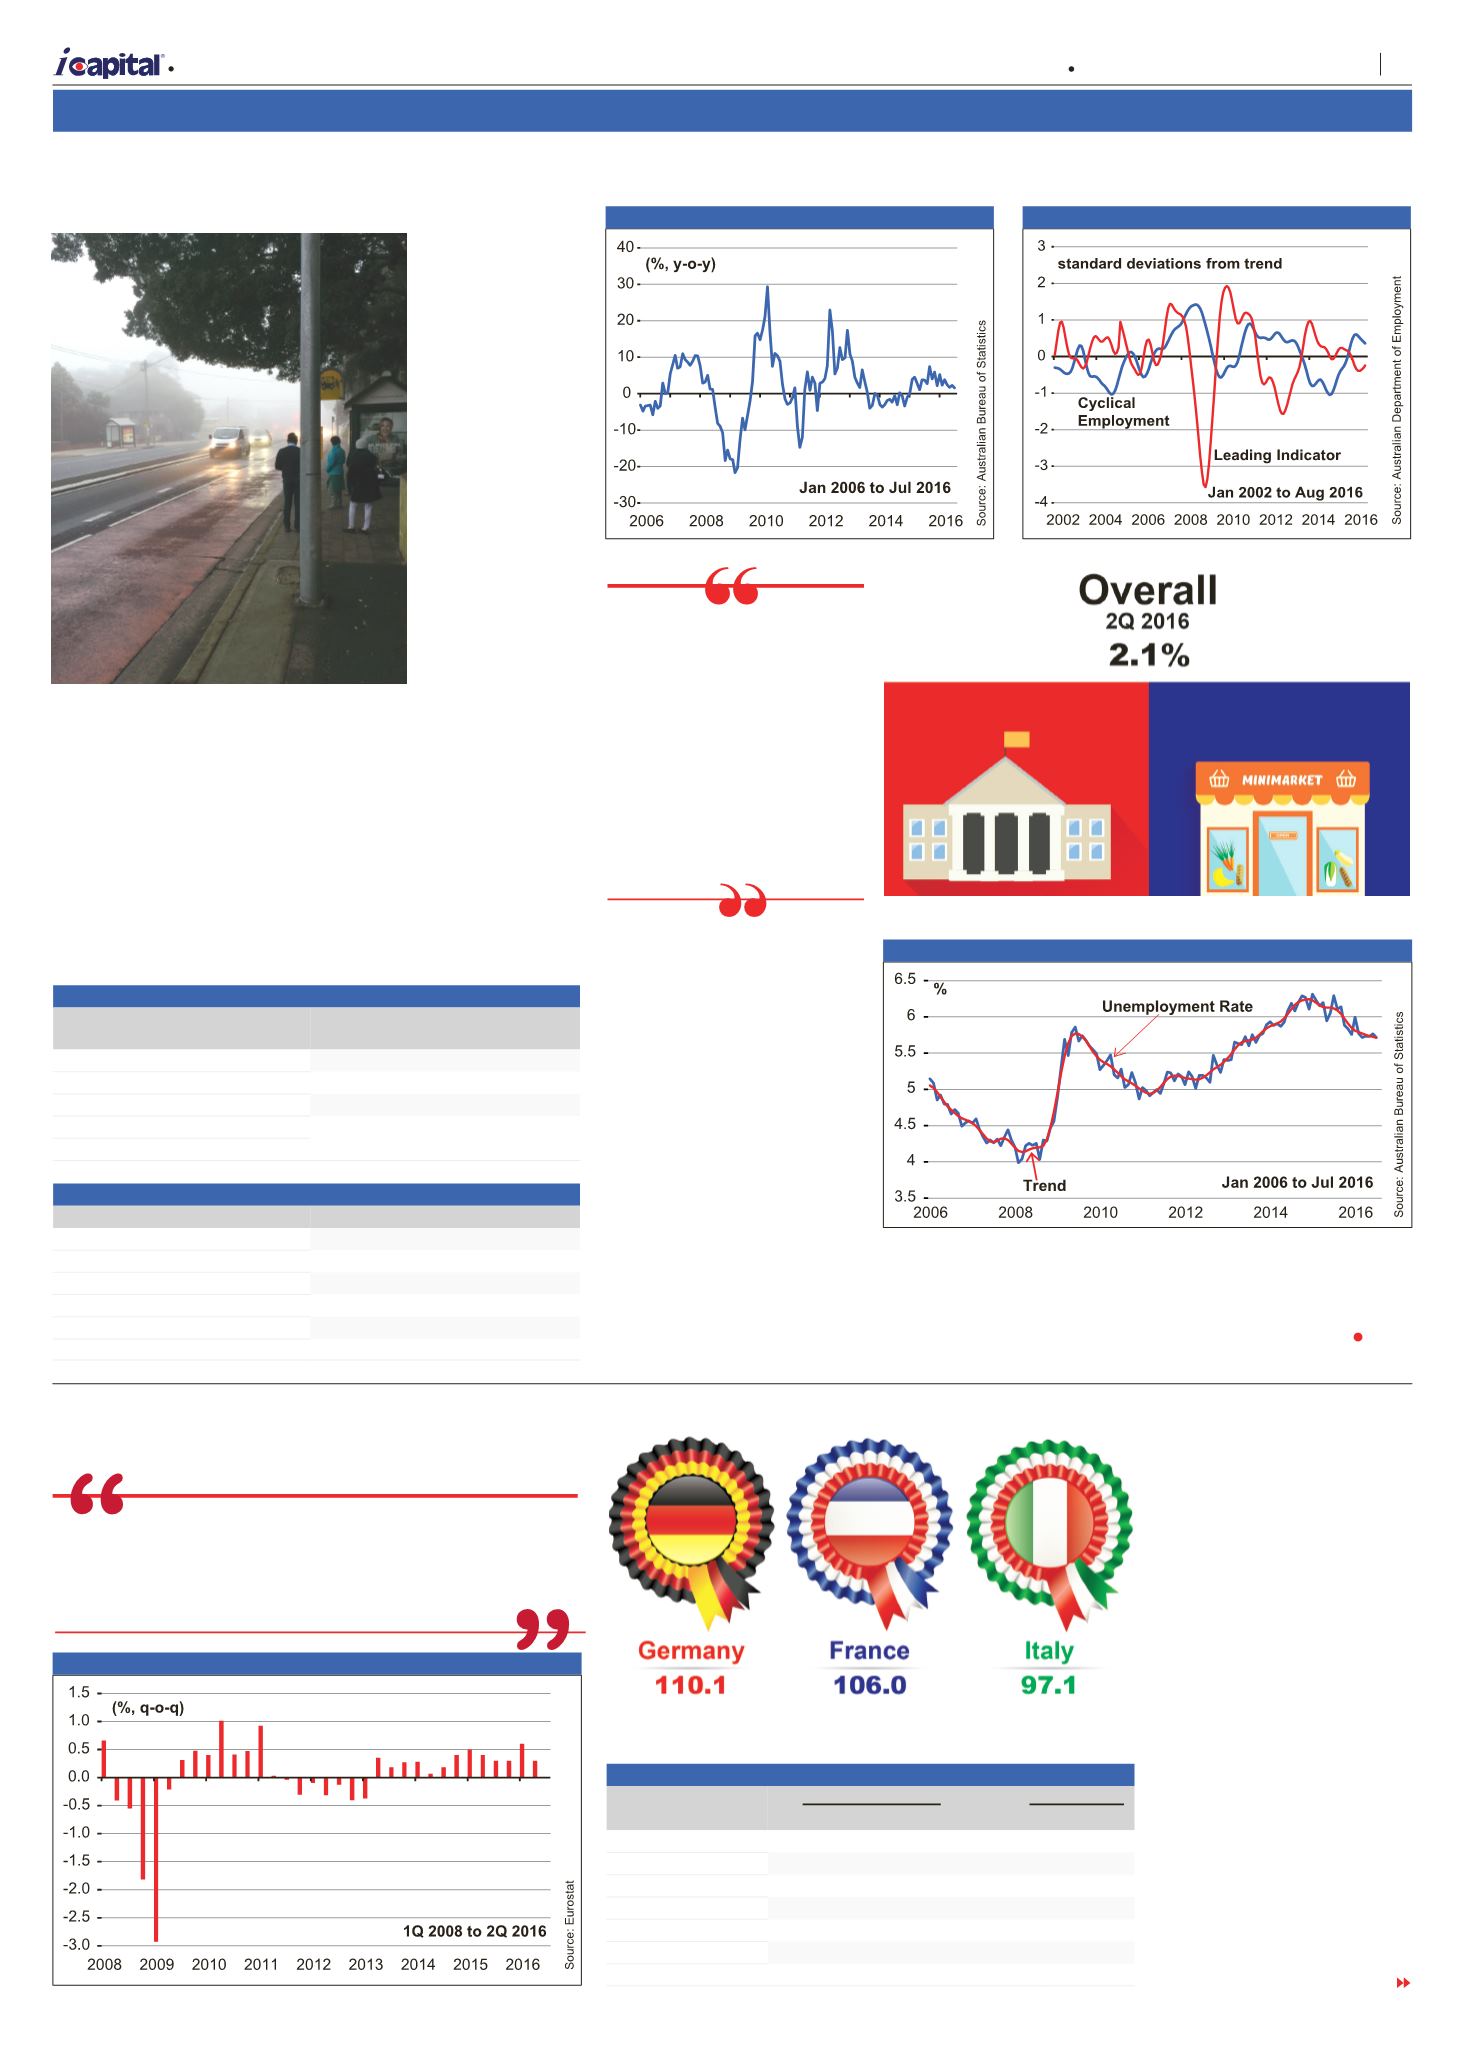
Source: Eurostat
Eurozone: 2Q 2016 real GDP (Flash estimates, Index 2010=100).
Source: Capital Dynamics
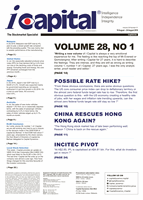
Climate change has impacted countries all over the world.
Australia is no exception. Yet, one does not get the sense
that the Australian politicians have seriously focused
on dealing with this life changing or life threatening
development.
Source: Australian Bureau of Statistics
Australian Wage growth (y-o-y).
GDP (flash estimates)
In 2Q 2016,
Eurozone’s real GDP
grew by 0.3% on a
quarter-on-quarter
basis – see
figure 26
.
All the major Eurozone
economies saw lower
growth rates, with
Portugal being an
exception – see
table 26
.
Year-on-year, real GDP
grew at a slower rate of
1.6%.
Industrial production
In Jun, industrial
production rose by 0.6%
Eurozone
TURN TO PAGE 10
Figure 23 New Motor Vehicle Sales
Figure 24 Leading Indicator of Employment and Cyclical Employment
Figure 25 Unemployment Rate
Figure 26 Real GDP Growth
Australia
New motor vehicle sales
In Jul, the sales of new
motor vehicles slipped 1.3%
from Jun in seasonally
adjusted terms, with the
sales of passenger vehicles
contracting by 5.2% – see
Table 24 New motor vehicle sales (% change)
From
Jun 2016
From
Jul 2015
Total Vehicles
-1.3
1.6
Passenger vehicles
-5.2
-6.3
Sports utility vehicles
1.5
6.9
Other vehicles
1.8
9.8
Source: Australian Bureau of Statistics
Table 25 Labour Indicators
Jun 2016 Jul 2016 Change
Unemployment rate
(%)
5.8
5.7 -0.1 ppts
Participation rate
(%)
64.9
64.9 0.0 ppts
Employment
(‘000 persons)
11,942.4 11,968.6
26.2
Full-time
8,199.3 8,153.9
-45.4
Part-time
3,743.1 3,814.7
71.6
Source: Australian Bureau of Statistics
table 24
. In trend
terms, the sales
of motor vehicles
edged up by 0.1%,
month-on-month.
Year-on-year, new
motor vehicle sales
grew by 1.6%, a
rate slower than
that of the previous
month – see
figure
23
. The increase
in car sales was
mainly supported
by gains in the
sales of sports
utility and other
vehicles.
Leading indicator
of employment
The monthly
leading indicator
of employment
the leading indicator leads
cyclical employment by
roughly one year, the growth
rate of employment is likely
to fall further in the coming
months – see
figure 24.
Unemployment rate
In seasonally adjusted
terms, Australia’s
unemployment rate edged
down to 5.7% in Jul.
Meanwhile, in trend terms,
the unemployment rate
remained flat at 5.7% – see
figure 25
.
The seasonally adjusted
number of employed persons
rose by 26,200 in Jul, as the
gain in part-time employment
outweighed the decline
in full-time employment.
Meanwhile, the participation
rate remained unchanged at
64.9% – see
table 25
.
As the leading
indicator leads
cyclical employment
by roughly one year,
the growth rate of
employment is likely
to fall further in the
coming months.
Table 26 Real GDP Growth (%)
quarter-on-quarter
year-on-year
1Q 2016 2Q 2016 1Q 2016 2Q 2016
Eurozone
0.6
0.3
1.7
1.6
Germany
0.7
0.4
1.8
1.7
Spain
0.8
0.7
3.4
3.2
France
0.7
0.0
1.3
1.4
Italy
0.3
0.0
1.0
0.7
Portugal
0.2
0.2
0.9
0.8
Source: Eurostat
Eurozone economies saw lower
growth rates,
with Portugal
being an exception
.
rose for the fourth month
in Aug. The increase was
broad based, with all the
components, except for US
Yield Difference, rising in
Aug. On the other hand, the
cyclical employment index
continued to decline. As
9
Capital Dynamics Sdn Bhd