


 7 / 36

The week of 18 August – 24 August 2016
Volume 28 Number 01
Source: Capital Dynamics
For the faltering Hong Kong economy, will Chinese tourists rescue it again or will
anti-China sentiment there be causing more self-inflicted wounds?
Source:
statistics.gov.hkExport-importof services,2Q 2016,y-o-y %
growth for 2016 to be in
the range of 0.0% - 2.0%.
Year-on-year growth
forecasts for 3Q 2016
and 4Q 2016 are -0.0%
- 2.0% and -0.5% - 1.5%
respectively.
Regular updates
Retail sales
Seasonally adjusted,
retail sales in Jun fell by
Table 20 Retail Sales (% change)
From
May 2016
From
Jun 2015
Total
-1.5
0.9
Total (excl motor vehicles)
-3.7
-3.0
Department stores
-1.8
-3.8
Supermarkets
0.1
-2.2
Mini-marts & convenience stores
-1.4
0.0
Food & beverages
-2.5
-5.5
Motor vehicles
7.8
17.1
Petrol service stations
-2.8
-14.1
Medical goods & toiletries
-2.4
3.0
Wearing apparel & footwear
-7.2
-4.4
Furniture & household equipment
-2.0
5.8
Recreational goods
-11.3
-11.8
Watches & jewellery
-3.3
-1.4
Telecommunications apparatus & computers
-10.2
-25.1
Optical goods & books
-5.9
-6.8
Others
-5.0
8.6
Source: Department of Statistics Singapore
Table 21 NODX (y-o-y % change)
May 2016 Jun 2016 Jul 2016
Total
11.6
-2.4
-10.6
Electronic products
-6.0
-1.7
-12.9
Disk drives
-24.6
-26.9
-17.1
PCB assembled
-12.6
-8.5
-18.8
Integrated circuits
-4.8
7.0
-1.0
Telecommunications equipment
-0.8
4.0
-23.4
Consumer electronics
86.1
64.9
10.2
Non-electronic products
19.0
-2.6
-9.5
Total chemicals
-4.1
-9.0
-9.3
Pharmaceuticals
5.6
-1.2
12.7
Petrochemicals
-12.1
-15.6
-35.0
Source: International Enterprise Singapore
1.5% from May. Excluding
motor vehicles, they slipped
3.7% – see
table 20
. The
decline in retail sales was
broad based. Retail sales
of recreational goods
and telecommunications
apparatus & computers
slumped by 11.3% and
10.2% respectively in Jun.
On the other hand, the
motor vehicle sector was
the only cluster reporting
significant expansion.
Year-on-year, retail sales
expanded by 0.9%, again
mainly supported by a surge
in motor vehicle sales.
Excluding motor vehicles,
retail sales fell by 3.0% from
a year ago – see
figure 12
.
External trade
Year-on-year, total
trade slumped 11.1% in
Jul, with total exports and
imports falling by 10.3% and
12.1% respectively. Non-oil
domestic exports (NODX)
declined by 10.6% in Jul
after a 2.4% contraction in
Hong Kong
Table 22 Real GDP ( y-o-y, % change)
2Q 2015 1Q 2016 2Q 2016
Real GDP
3.1
0.8
1.7
Private consumption expenditure
6.8
1.2
0.6
Government consumption expenditure
3.6
3.3
3.4
Gross domestic fixed capital formation
3.9
-9.6
-4.9
Source: Hong Kong’s Census and Statistics Department
GDP
In 2Q 2016, Hong Kong’s
real GDP grew by 1.7%
on a year-on-year basis,
doubling the growth rate of
the preceding quarter – see
figure 14
. The contraction
in investment slowed, but
private consumption growth
also moderated substantially
– see
table 22.
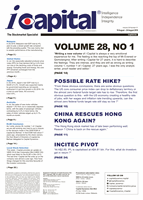
Meanwhile, the exports
and imports of goods rose
2.0% and 0.2% respectively.
The exports of services on
the other hand, fell by 4.6%,
while the imports of services
rose 1.1%.
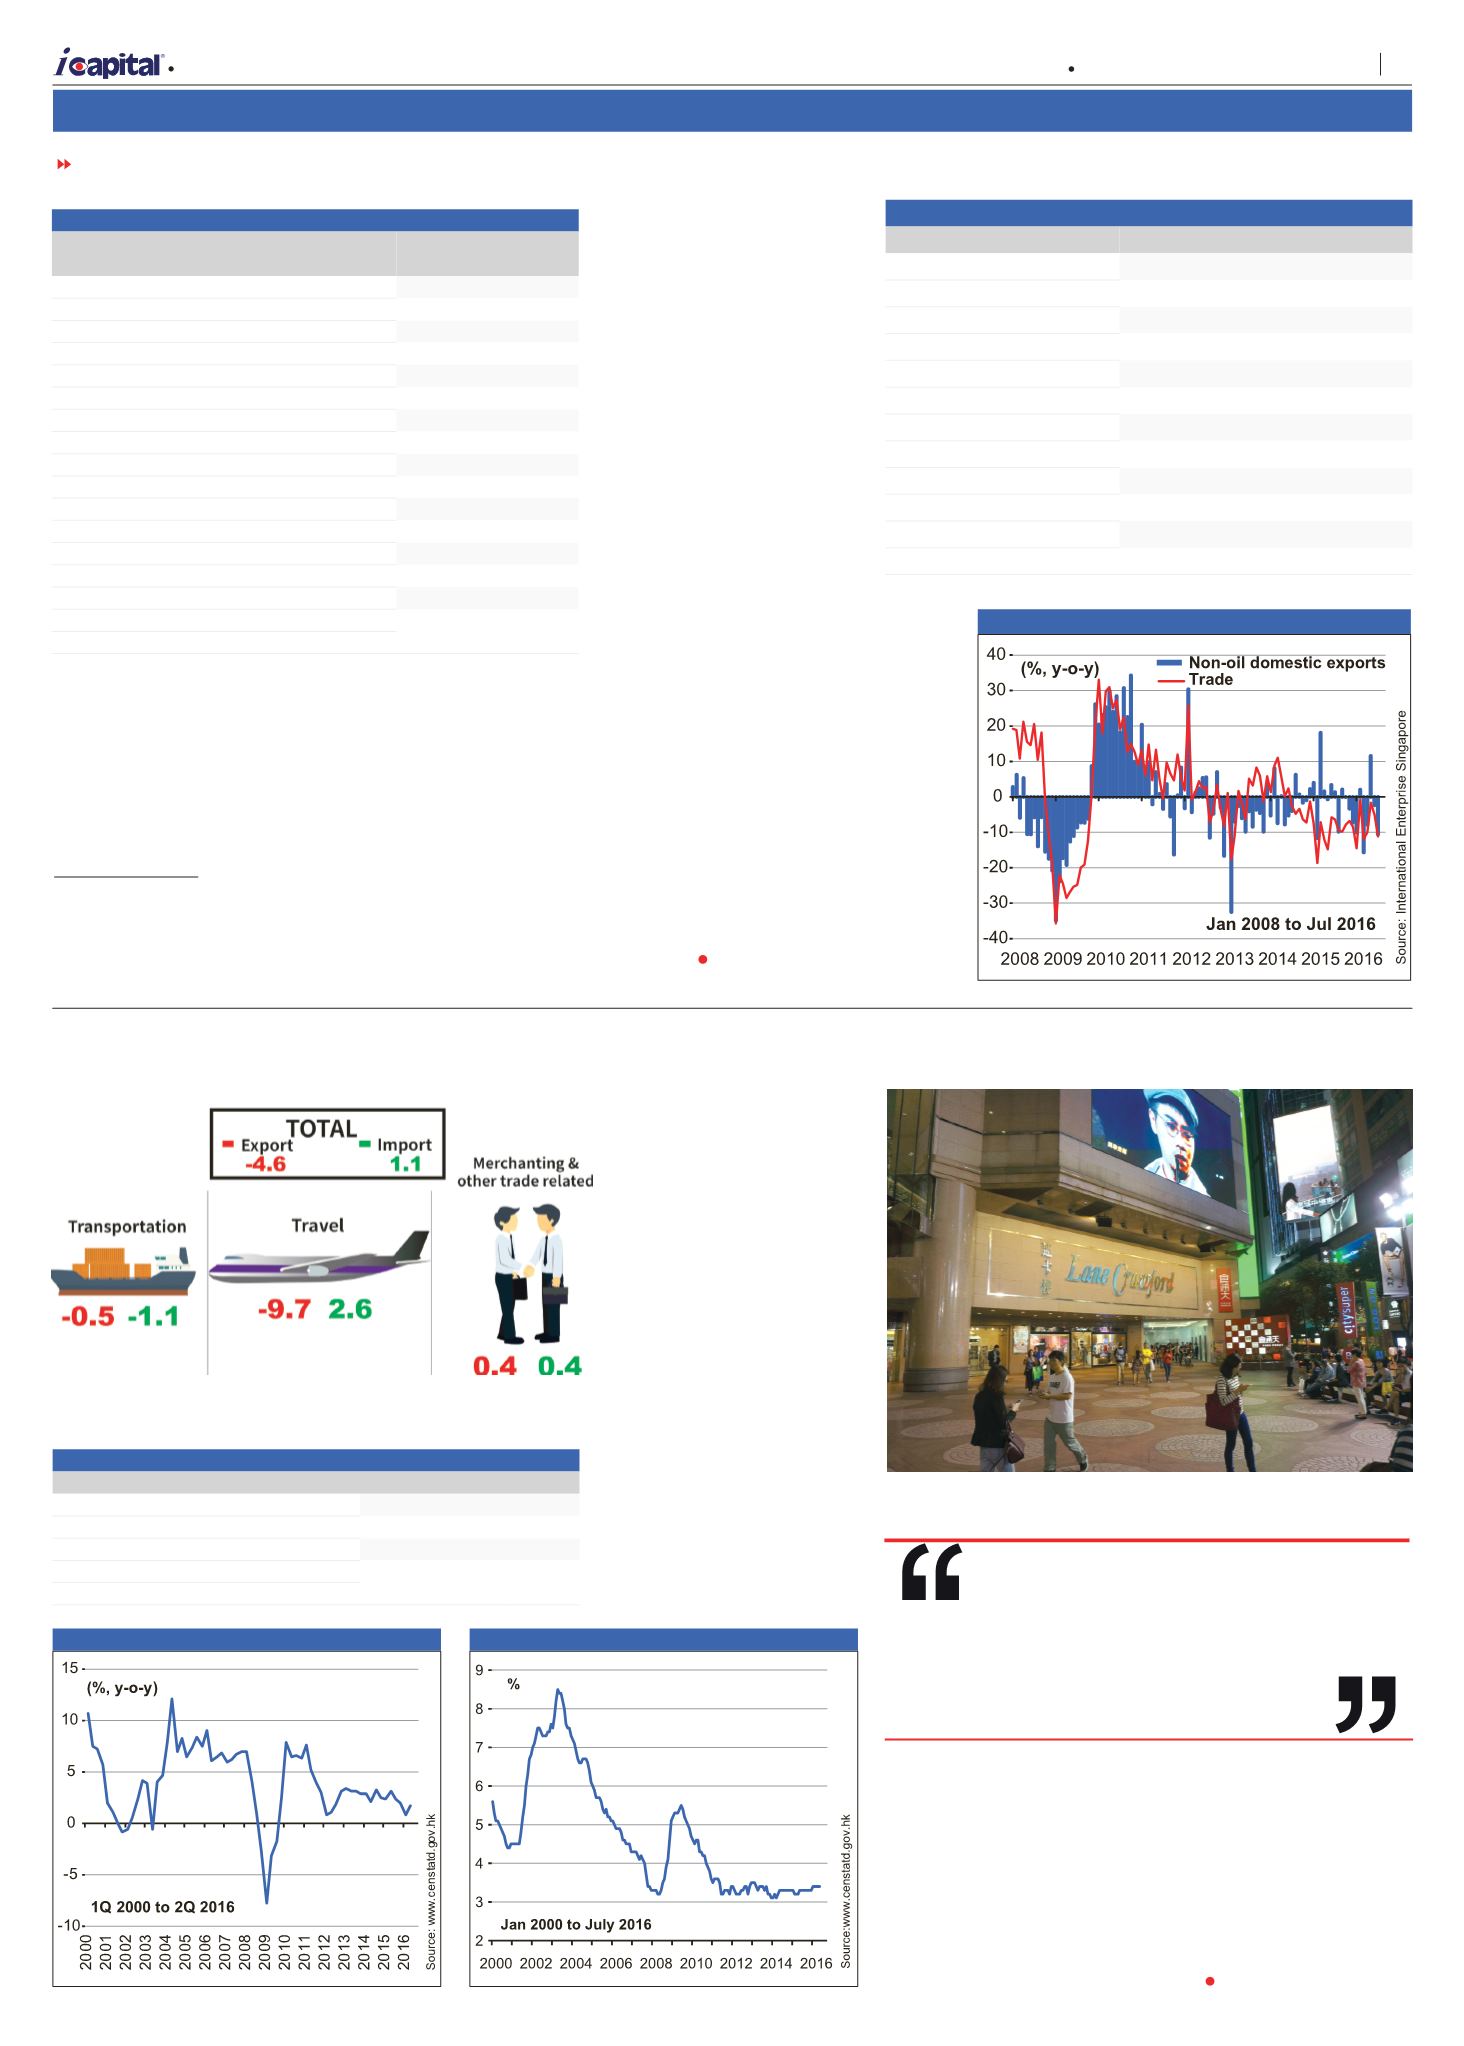
Unemployment
In May-Jul, Hong
Kong’s seasonally adjusted
unemployment rate remained
unchanged at 3.4% – see
figure 24. Total employment
edged up by 4,300 persons,
while the number of
unemployed grew by 2,700
persons. The consumption
and tourism-related segment
continued to register a
year-on-year decline in
employment for the 15th
consecutive period. Due to
weak local consumption and
inbound tourism, the labour
market condition is expected
to remain weak in the near
term.
Jun – see
figure 13
. Electronic NODX
fell by 12.9%, while non-electronic
NODX decreased by 9.5% in Jul from
the same period a year ago – see
table 21.
Meanwhile, non-oil re-exports
(NORX) decreased by 1.2%, year-on-
year.
NODX to the top 10 NODX markets,
with the exception of the EU, contracted
on a year-on-year basis in Jul. NODX
to Indonesia and the US tumbled 22.6%
and 19.1% respectively. Meanwhile,
NODX to emerging markets fell by
13.0% in Jul, mainly due to contractions
in NODX to South Asia, the Middle East
and CLMV.
FROM PAGE 6
Figure 15 Unemployment Rate
Figure 13 Trade and NODX
Figure 14 Real GDP
In 2Q 2016, Hong Kong’s real GDP
grew by 1.7% on a year-on-year
basis,
doubling the growth rate
of the preceding quarter.
A
| Market Opinion
7
Capital Dynamics Sdn Bhd