


 3 / 36

The week of 18 August – 24 August 2016
Volume 28 Number 01
Source: Capital Dynamics
Kuala Lumpur boasts of a fast expanding skyline. Look inside – you will find many of
them unoccupied. Not surprisingly, Tabung Haji recently slashed rentals of its offices.
In 2Q 2016, the headline inflation
rate moderated to 1.9% from 3.4%
in 1Q 2016.
Table 3 Manufacturing Output (y-o-y % change)
2Q 2015 1Q 2016 2Q 2016
Export-oriented industries
4.3
4.2
4.2
Electronics
-6.1
6.0
9.8
Electrical
37.7
6.4
7.8
Chemicals & chemical products
5.5
3.3
4.9
Petroleum products
0.9
1.2
5.0
Rubber products
7.6
6.9
4.7
Off-estate processing
7.3
2.7
-21.5
Domestic-oriented industries
3.5
4.6
2.8
Construction-related products
2.9
4.7
4.5
Fabricated metal products
2.8
5.4
5.9
Transport equipment
6.0
2.0
-7.4
Food, beverage & tobacco products
1.7
7.3
13.0
Overall
4.1
4.3
3.9
Source: Department of Statistics Malaysia, Bank Negara Malaysia
Demand Conditions
The year-on-year growth of
domestic demand jumped
to 6.3% in 2Q 2016 – see
table 4
. The year-on-
year growth of private and
public consumption further
improved to 6.3% and 6.8%,
respectively. Meanwhile,
investment registered a strong
expansion of 6.1% supported
by both private and public
investment.
Public Finance
In 2Q 2016, the federal
government deficit was
equivalent to 5% of GDP,
significantly higher than the
same period a year ago –
see
table 5
. Government
revenue declined due to
lower individual income tax
collections. Consequently, the
federal government debt rose
from 51% of GDP in 1Q 2015
to 53.4% of GDP in 2Q 2016.
Inflation
In 2Q 2016, the headline
inflation rate moderated to
1.9% from 3.4% in 1Q 2016.
This was mainly due to the
lapse of the GST impact,
which was implemented in Apr
last year.
Money Supply
The growth rate of broad
money supply, M3, picked up
to 1.9%, year-on-year, at the
end of Jun 2016 as a result of
continued credit expansion to
Table 4 Real Domestic Demand (y-o-y % change)
2Q 2015 1Q 2016 2Q 2016
Public consumption
6.9
3.8
6.5
Public investment
-8.1
-4.5
7.5
Private consumption
6.4
5.3
6.3
Private investment
3.9
2.2
5.6
Aggregate domestic demand
4.6
3.6
6.3
Source: Department of Statistics Malaysia, Bank Negara Malaysia
Table 5 Federal Government Finance (RM bln)
2Q 2015 1Q 2016 2Q 2016
Revenue
55.3
48.8
47.5
Operating expenditure
51.8
57.4
52.1
Current account
3.4
-8.6
-4.6
Net development expenditure
7.3
9.2
10.4
Overall balance
-3.8
-17.7
-15.0
Overall balance (% GDP)
-1.4
-6.1
-5.0
Source: Ministry of Finance Malaysia, Bank Negara Malaysia
Table 6 M3 Determinants (q-o-q change, RM bln)
2Q 2015 1Q 2016 2Q 2016
M3
-7.5
9.4
7.0
Net claims on government
-20.4
-0.9
-1.9
Claims on private sector
23.2
11.2
22.3
Net foreign assets
-3.5
-19.7
7.8
Other influences
-6.7
18.8
-21.2
Source: Bank Negara Malaysia
Table 7 Trade Balance (y-o-y % change)
2Q 2015 1Q 2016 2Q 2016
Gross exports
-3.7
1.0
1.4
Manufactured
2.3
6.4
4.8
Agriculture
-2.7
6.5
-2.9
Minerals
-36.0
-32.5
-24.4
Gross imports
-5.2
-0.4
3.1
Capital goods
-12.5
-12.9
10.2
Intermediate goods
-4.6
-3.1
-0.3
Consumption goods
25.4
24.6
9.9
Trade balance (RM bln)
20.4
23.9
17.9
Source: MATRADE, Department of Statistics Malaysia, Bank Negara Malaysia
the private sector – see
table
6
.
Interest Rates
The Overnight Policy Rate
was maintained at 3.25% in
2Q 2016, unchanged from
the preceding two quarters.
Meanwhile, the base lending
rate of commercial banks
edged up to 6.82%. The
1-month fixed deposit rate of
commercial banks remained
stable at 3.08%, while the
12-month fixed deposit rate
was lowered by 0.2 ppt to
3.29%.
External Trade
In 2Q 2016, exports
registered an improved
growth of 1.4%, mainly due
to a milder contraction in
the exports of minerals –
see
table 7
. Meanwhile,
imports rose by 3.1% in 2Q
2016 mainly due to a strong
expansion in capital goods
imports. Overall, the trade
surplus narrowed to RM17.9
bln in 2Q 2016.
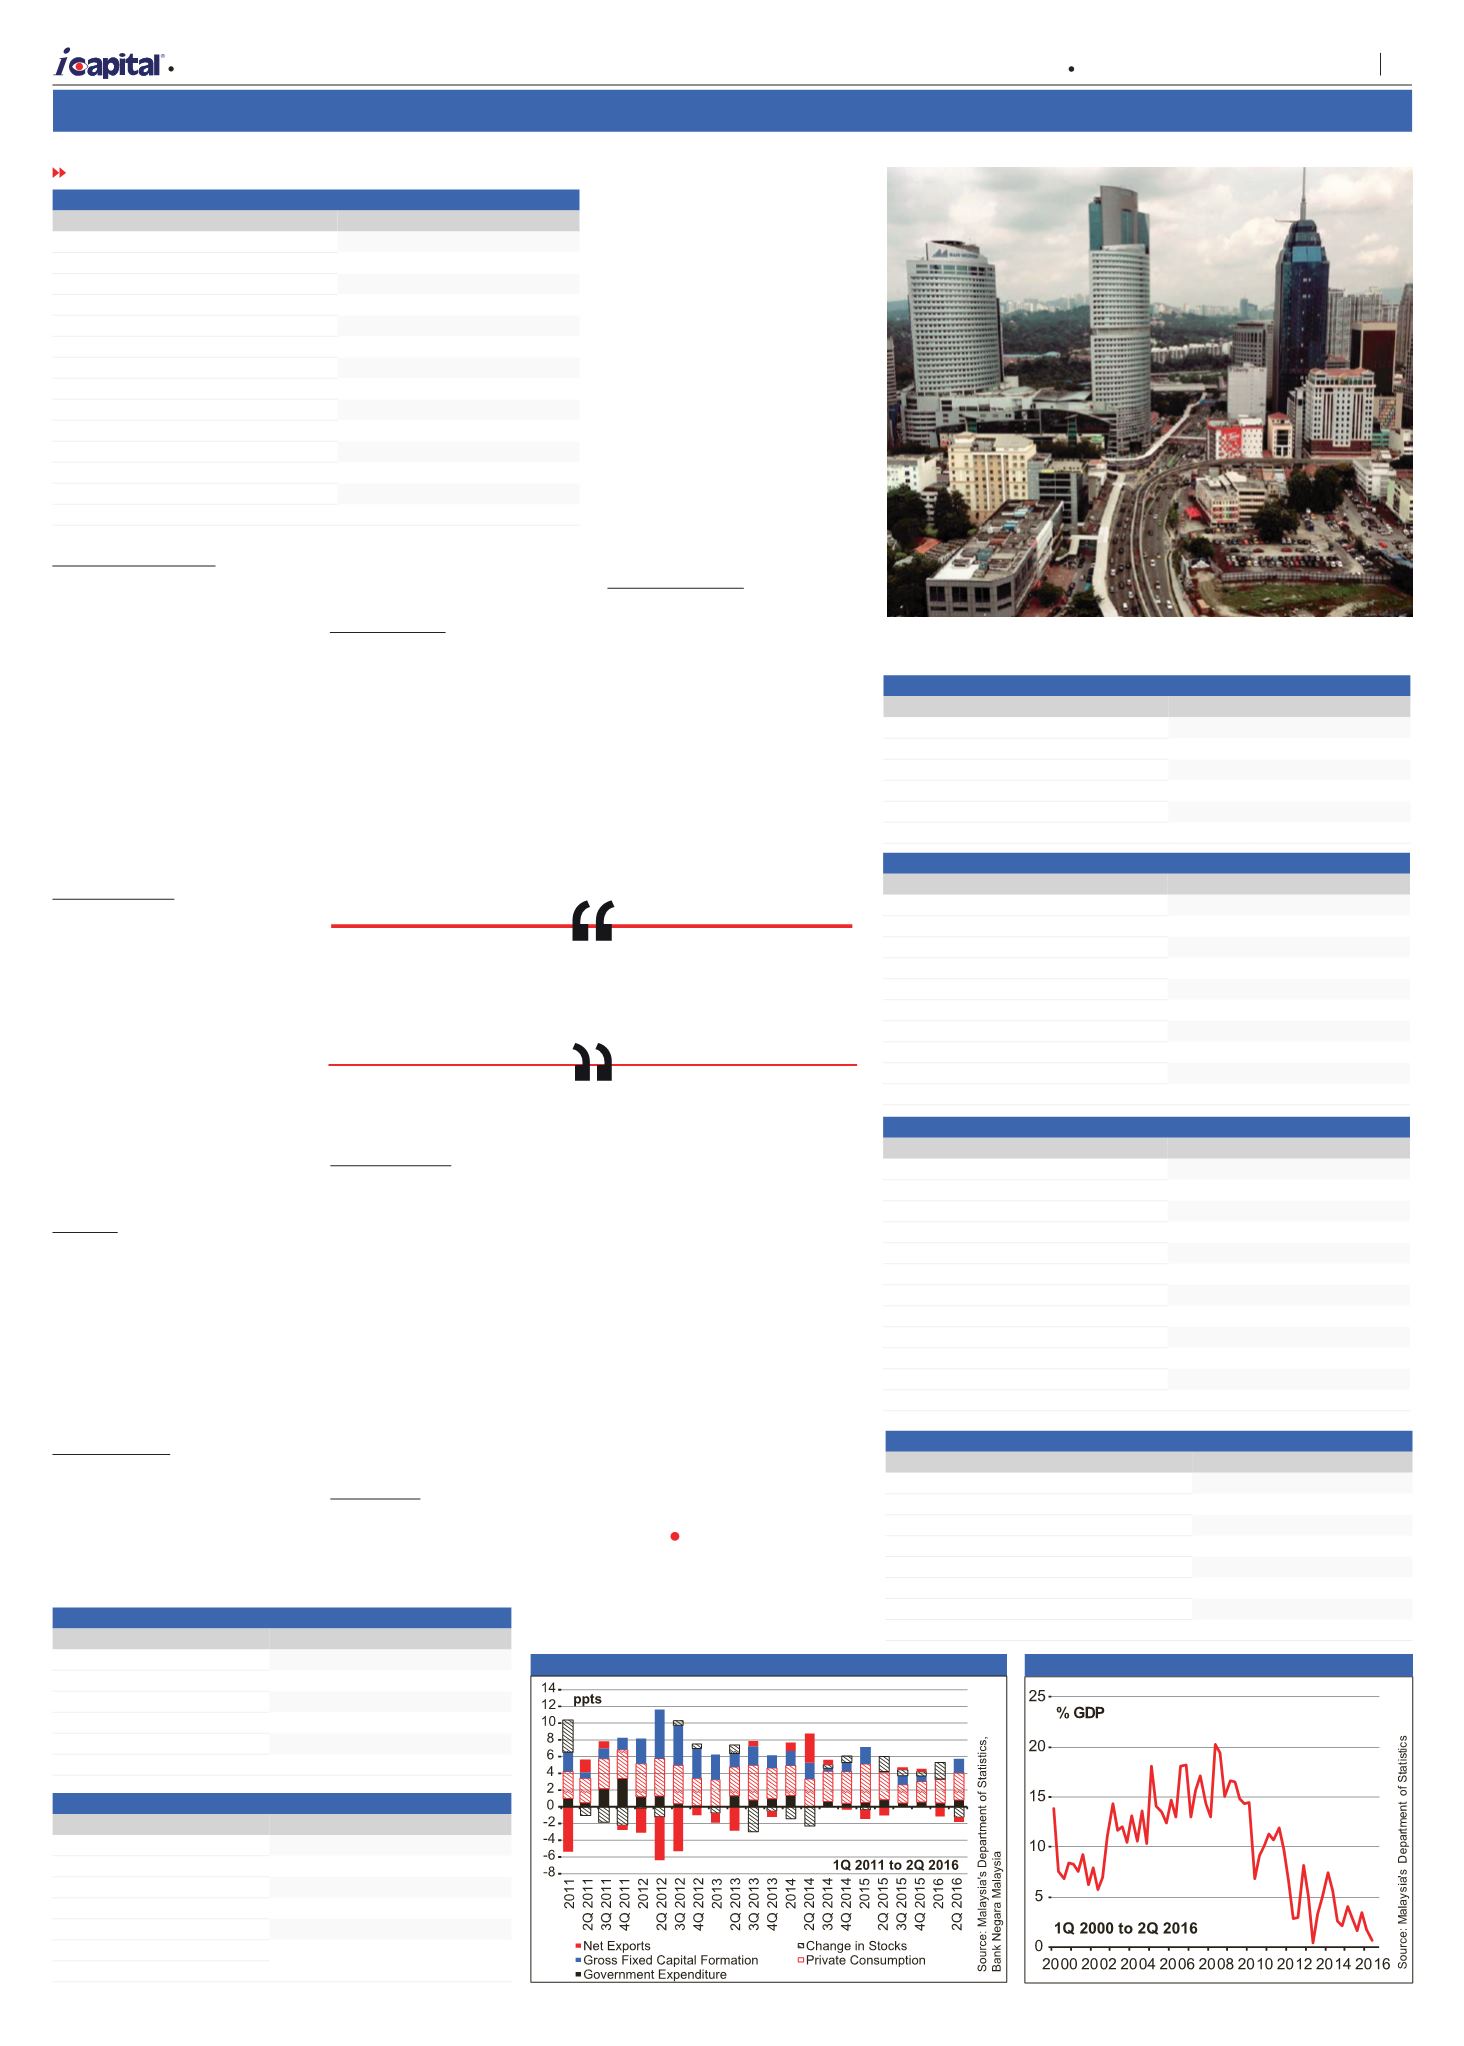
Comments
Private sector spending
remained the main growth
driver for the Malaysian
economy, with private
consumption alone
contributing 3.3 ppts to real
GDP growth in 2Q 2016 –
see
figure 1
. However, given
the weak global economic
conditions, Malaysia’s
economic growth could
weaken in the coming
quarters. This is reflected in
the falling leading index.
i
Capital forecasts Malaysia’s
real GDP growth for 3Q 2016
to be in the range of 3.0% -
4.5% but retains its forecast
for the whole of 2016 to be in
the range of 2.5% - 3.5%.
Regular updates
Balance of payments
In 2Q 2016, the current
account surplus more than
halved to RM1.88 bln. As
a percentage of GDP, the
current account surplus
also declined – see
figure
2
. The surplus in the goods
account fell, while the deficit
in the services account
narrowed too – see
table
8
. On the other hand, the
financial account recorded a
significantly larger net inflow
compared with the preceding
quarter as a result of higher
net inflows of direct and
other investments. Portfolio
investment experienced a
sharp decline in net inflow.
The overall balance of
payments registered a surplus
of RM8.77 bln.
The deficit in the services
account narrowed to
RM4.6 bln in 2Q 2016, led
by a smaller deficit in the
construction sector and larger
surpluses in the travel and
manufacturing sectors – see
table 9
.
Table 8 Balance of Payments (net in RM mln)
2Q 2015 1Q 2016 2Q 2016
Goods
23,648 23,490 19,808
Services
-4,983 -6,826 -4,634
Primary Income
-4,606 -6,688 -8,230
Secondary Income
-5,928 -4,937 -5,060
Current Account
8,131 5,039 1,884
Financial Account
5,741 5,789 9,496
Direct Investment
666 3,732 5,304
Portfolio Investment
-11,787 13,105
77
Other Investment
-449 -11,535 4,102
Errors & Omissions
-4,316 -38,388 -2,726
Overall Balance
8,450 -27,570 8,771
Source: Malaysia’s Department of Statistics
Table 9 Services Account Balance (net in RM mln)
2Q 2015 1Q 2016 2Q 2016
Transportation
-6,204 -5,567 -6,028
Travel
7,141 6,748 7,580
Manufacturing
1,986 2,008 2,214
Construction
-1,612 -2,297 -1,012
Insurance and pension
2,083 -1,974 -2,097
Charges for the use of intellectual property 1,170 -1,300 -1,139
Total
-4,983 -6,826 -4,634
Source: Malaysia’s Department of Statistics
FROM PAGE 2
Figure 2 Current Account Balance
Figure 1 Contribution to Real GDP Growth
A
| Market Opinion
3
Capital Dynamics Sdn Bhd