


 2 / 36

The week of 18 August – 24 August 2016
2
Intelligence
Independence
Integrity
Capital Dynamics Sdn Bhd
Volume 28 Number 01
Malaysia
A.1 Economic Fundamentals
Note fromPublisher :
This issue of
i
Capital marks another milestone for Capital Dynamics and
i
Capital.
With Volume 28, Number 1, we enter the 28th year of providing sound, objective,
and independent investment advice. We thank all subscribers and supporters for
staying with us throughout the years. Without any advertisement, each issue of
i
Capital is filled with solid original research and zero tips and rumours. This is
because it believes that in order to achieve superior return in the stockmarket, one
must do serious investing and to do that serious investment research is required.
At the same time,
i
Capital prides on itself as a publication that writes without fear
or favour, without hidden agenda. Capital Dynamics has no ties, past or present,
with any politicians, political entities, government organisations, investment
or commercial banks. As a consequence, Capital Dynamics is simply not placed
in a situation filled with conflicts of interest. In producing
i
Capital since 1989,
Capital Dynamics has never had to compromise its long-held core principles of
independence, intelligence and integrity.
i
Capital was born because Tan Teng
Boo recognised that Malaysians do not have access to sound, unbiased advice
or alternate views that are not pro or controlled, either openly or quietly, by any
political entities.
i
Capital has come this far because it believes in being a truth
seeker, no matter how painful it may be.
Being guided by its core value of independence, intelligence, and integrity,
i
Capital
will continue to be an investment advisor that serious investors and businessmen
can trust and rely on in the decades to come.
Low Guat Meng,
Executive Director
Date to be expected (Date in parentheses is actual release date).
Economic Calendar
Definitions:
Immediate-term :
next few weeks.
Short-term :
up to 7/8 months.
Medium-term :
up to 2/3 years.
Long-term :
beyond 3 years.
Source: Department of Statistics Malaysia,
Bank Negara Malaysia
Value add in agriculture,(%)
22 Aug – 28 Aug
29 Aug – 04 Sep
Malaysia (24 Aug) Jul consumer price index
Jul producer price index
(25 Aug) Jun leading index
Jul money supply
Jul bank lending
US
(23 Aug) Jul new home sales
Jul personal income
(24 Aug) Jul existing home sales
Jul consumer spending
(25 Aug) 20 Aug initial claims
Aug consumer confidence index
(25 Aug) Jul durable goods orders
27 Aug initial claims
(26 Aug) 2Q GDP (2nd estimate)
Aug manufacturing PMI
Aug auto sales
Aug employment report
Jul trade balance
Japan (26 Aug) Jul consumer price index
Jul retail sales
Jul employment report
Jul household spending
Jul industrial production
Jul housing starts
Aug auto sales
China
Aug manufacturing PMI
Aug non-manufacturing PMI
Europe (26 Aug) Jul money supply, M3
Jul unemployment
Jul producer price index
Singapore
(23 Aug) Jul consumer price index
Jul trade price indices
(26 Aug) Jul industrial production
Hong
Kong
(22 Aug) Jul consumer price index
Jul retail sales
(25 Aug) Jul external trade
Jul money supply
Jul bank lending
Jul domestic home prices
Jul tourist arrivals
Australia
Jul private credit
Jul money supply
Aug index of commodity prices
Aug manufacturing PMI
Jul retail trade
Table 1 Performance of the Major Sectors (y-o-y % change)
2Q 2015 1Q 2016 2Q 2016
Agriculture
4.6
-3.8
-7.9
Mining & quarrying
6.0
0.3
2.6
Manufacturing
4.2
4.5
4.1
Construction
5.6
7.9
8.8
Services
5.0
5.1
5.7
Real GDP
4.9
4.2
4.0
Nominal GDP
4.1
4.9
5.4
Source: Department of Statistics Malaysia, Bank Negara Malaysia
Table 2 Value Add in the Services Sector (y-o-y % change)
2Q 2015 1Q 2016 2Q 2016
Finance & insurance
0.2
0.1
1.6
Real estate & business services
6.2
6.4
6.8
Transport & storage
5.4
5.8
5.9
Information & communication
9.3
8.5
8.8
Wholesale & retail trade
5.8
5.2
6.6
Food & beverages and accommodation
6.6
6.1
6.9
Utilities
3.9
6.7
5.4
Government services
4.0
5.3
4.9
Other services
4.7
4.6
4.4
Source: Department of Statistics Malaysia, Bank Negara Malaysia
Performance of the
Malaysian Economy in 2Q
2016
In 2Q 2016, Malaysia’s
real GDP rose by 4%,
year-on-year, a slower
growth rate compared with
the preceding quarter – see
table 1
. This was mainly due
to weaker performance of the
manufacturing and agriculture
sectors. Meanwhile, in
nominal terms, GDP growth
picked up to 5.4% in 2Q 2016.
Supported by stronger
household spending, the
services sector registered a
stronger growth rate of 5.7%
in 2Q 2016 – see
table 2
.
The slower growth in the
manufacturing sector was
primarily pulled down by
domestic-oriented industries
that grew a paltry 2.8%
compared with the same
quarter last year – see
table
3
. Apart from firm demand
for food, beverage & tobacco
products, domestic-oriented
industries generally recorded
weaker performance with
transport equipment industry
registering negative growth
rate. On the other hand,
growth in the export-oriented
industries was largely
supported by stronger
expansion in the electronics
and petroleum products
industries, which offset a
contraction in the off-estate
processing sector.
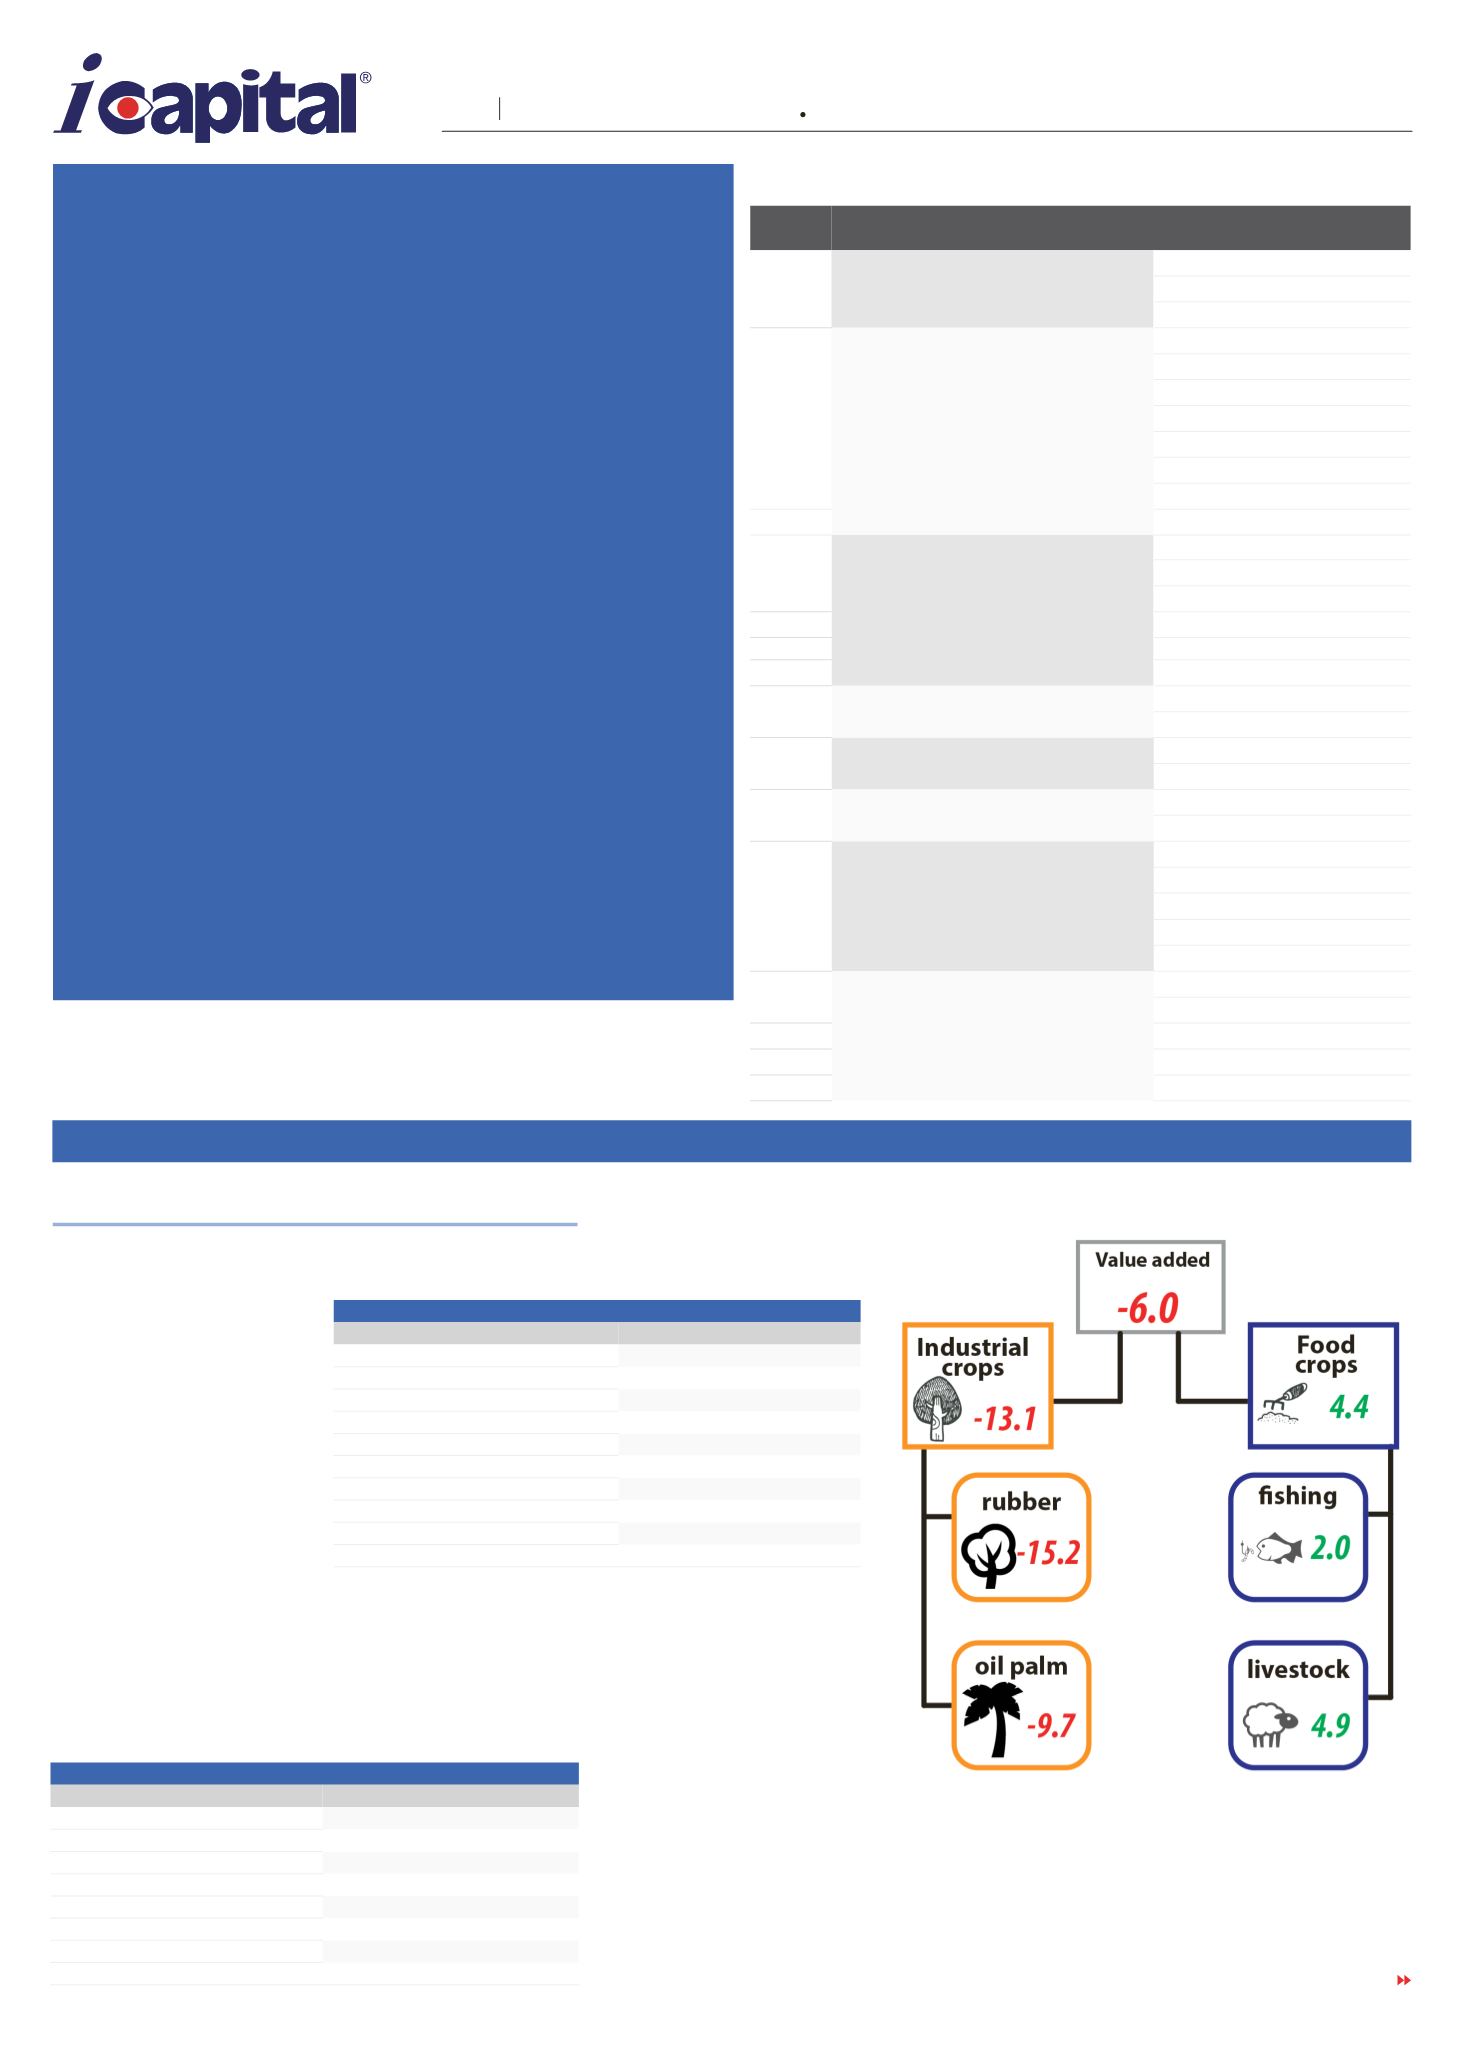
The stronger contraction
in the agriculture sector was
a result of lower palm oil
production arising from the
lagged effect of El Niño. The
mining sector expanded 2.6%
due to improvement in natural
gas output. Meanwhile,
growth in the construction
sector accelerated to 8.8%,
driven by stronger growth
in the civil engineering
sub-sector.
TURN TO PAGE 3
This section is based on a top-down/market-timing approach. In each issue of
i
Capital
®
, Capital Dynamics will look at the major
economic variables, locally and abroad, major equity markets plus some technical indicators before reaching its conclusion for the
KLSE Composite Index. In other words, Section A should be read in toto.
A
| Market Opinion