


 4 / 36

The week of 18 August– 24 August 2016
Volume 28 Number 01
Source: Bureau of Labour Statistics
US: Cost of energy in Jul 2016 (Change from the prior month)
In Jul, industrial
production rose
0.7% from Jun,
with a broad-
based increase in
all major industry
groups
United States
Producer price index
In Jul, the seasonally
adjusted producer price
index (PPI) for final demand
fell by 0.4% from Jun due
to the declining costs of
foods and energy – see
table 10
. Excluding foods
and energy, the core PPI
remained unchanged from
the previous month. On
a year-on-year basis, the
headline PPI fell by 0.2%,
while the core PPI rose
by 0.8% – see
figure 3
.
Nevertheless, inflationary
pressure is likely to remain
mild in the coming months
amidst an uncertain global
economic outlook.
Retail sales
In Jul, retail sales
remained unchanged,
month-on-month, mainly
supported by a strong
increase in the sales of
motor vehicles & parts – see
table 11
. Excluding motor
Table 11 Retail Sales (% change)
Change from
prior month
Change from
prior year
Total
0.0
2.3
Ex-auto & parts
-0.3
2.2
Motor vehicles & parts
1.1
2.4
Furniture & home furniture
0.2
4.3
Electronics & appliance
-0.1
-3.8
Food & beverages
-0.6
1.4
Health & personal care
0.1
7.8
Gasoline stations
-2.7
-11.0
Clothing & clothing accessories
-0.5
-1.2
General merchandise
-0.1
-1.1
Source: Census Bureau
Table 10 Producer Price Index (% change from prior month)
May 2016 Jun 2016 Jul 2016
Total final demand
0.4
0.5
-0.4
Final demand goods
0.7
0.8
-0.4
Excluding foods and energy
0.3
0.0
0.0
Foods
0.3
0.9
-1.1
Energy
2.8
4.1
-1.0
Final demand services
0.2
0.4
-0.3
Source: Bureau of Labour Statistics
Table 12 Consumer Price Index (% change from the prior month)
May 2016 Jun 2016 Jul 2016
All Items
0.2
0.2
0.0
All items less food and energy
0.2
0.2
0.1
Energy
1.2
1.3
-1.6
Food
-0.2
-0.1
0.0
Apparel
0.8
-0.4
0.0
Shelter
0.4
0.3
0.2
Transportation
0.3
0.3
-0.2
Medical care
0.5
0.2
0.5
Source: Bureau of Labour Statistics
from the previous month.
Excluding the food and
energy components, the
core CPI edged up
by 0.1% – see
table
12
. Year-on-year,
the headline CPI
rose by 0.8%, while
the core CPI rose by
2.2% – see
figure 5.
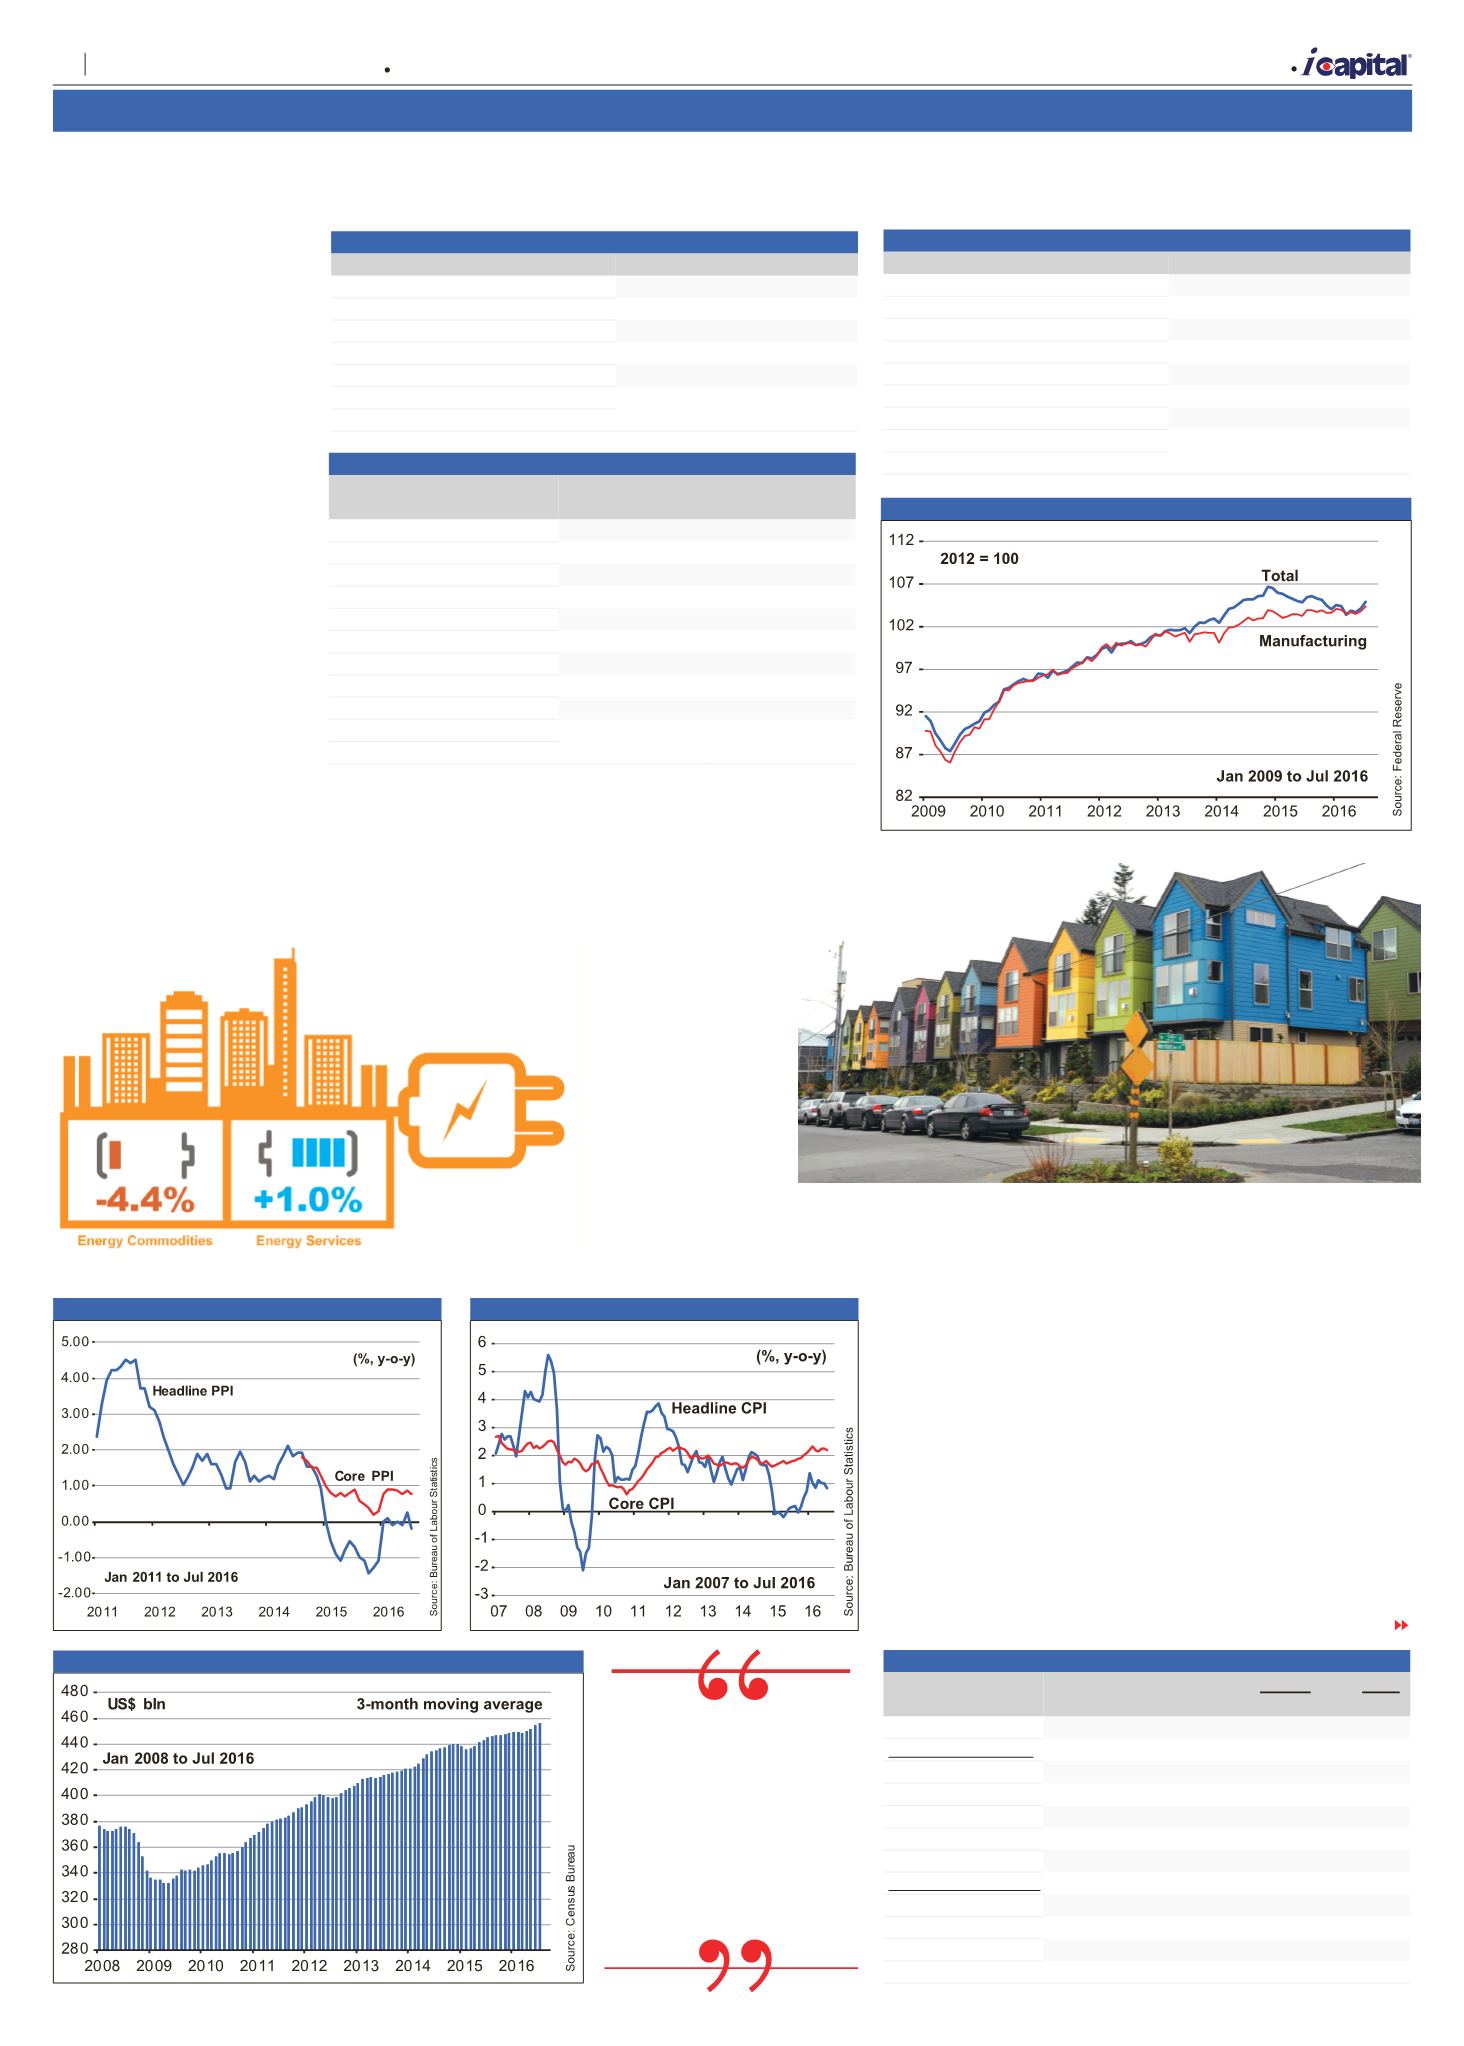
Industrial
production
In Jul, industrial
production rose
0.7% from Jun,
with a broad-
based increase in
all major industry
groups – see
table
13
. The overall
vehicles & parts, retail sales
fell by 0.3%. On a year-on-
year basis, retail sales rose
by 2.3% – see
figure 4
.
Consumer price index
The headline consumer
price index (CPI) in Jul
remained unchanged
industry capacity utilisation
rate also rose from 75.4%
in Jun to 75.9% in Jul.
On a year-on-year basis,
industrial production fell by
0.5%. Due to a relatively
strong US$ and weak global
demand, growth in industrial
production is expected to
remain modest in the coming
months – see
figure 6
.
Housing starts
Housing starts in Jul rose
2.1%, month-on-month, and
5.6%, year-on-year, to a
seasonally-adjusted annual
rate (SAAR) of 1.211 mln
units. Housing starts have
exceeded 1 mln units for the
16th consecutive month –
see
figure 7
. The number
of single-family and multi-
family housing units under
construction rose 0.5% and
8.3%, month-on-month,
respectively. Year-on-year,
single-family housing starts
increased 1.3% to a SAAR
of 770,000 units, while
Source:flickr.WonderlaneThe number of US housing starts rose to its fastest pace. However, signs of a
slowdown in building permits require vigilant observation.
Table 13 Industrial Production (%)
May 2016 Jun 2016
m-o-m
Jul 2016
y-o-y
Jul 2016
Total industry
-0.2
0.4
0.7
-0.5
Major market groups
Final products
-0.3
0.5
0.6
0.1
Consumer goods
-0.4
0.5
0.6
0.7
Business equipment
-0.1
0.6
0.6
0.0
Construction
-0.8
-0.3
0.4
1.5
Materials
0.0
0.5
1.0
-1.5
Major industry groups
Manufacturing
-0.2
0.3
0.5
0.2
Mining
0.8
-0.3
0.7
-10.5
Utilities
-0.4
2.1
2.1
3.5
Source: Federal Reserve
TURN TO PAGE 5
Figure 3 Producer Price Index
Figure 4 Retail Sales
Figure 6 Industrial Production Index
Figure 5 Consumer Price Index
A
| Market Opinion
4
Capital Dynamics Sdn Bhd