


 6 / 36

The week of 18 August– 24 August 2016
Volume 28 Number 01
Source: Capital Dynamics
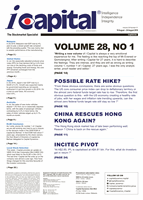
At only 0.3%, Singapore’s GDP growth crawled to almost a standstill in the 2nd quarter
and exports are still plunging.
Source: Ministry of Trade and Industry
Singapore
Change in unit labour cost in 2Q
2016 (y-o-y)
Table 16 Sectorial Performance (%)
Year-on-Year Growth Contribution to GDP Growth (ppts)
2Q 2015 1Q 2016 2Q 2016 2Q 2015 1Q 2016 2Q 2016
Goods-producing Industries
-3.2
0.6
1.6
-0.8
0.1
0.4
Manufacturing
-5.2
-0.5
1.1
-1
-0.1
0.2
Construction
3.6
4.0
3.3
0.2
0.2
0.2
Services-producing Industries
3.2
1.7
1.4
2.1
1.1
0.9
Wholesale & retail trade
5.5
2.9
2.2
1.0
0.5
0.4
Transport & storage
-1.0
-0.1
2.9
-0.1
0.0
0.2
Accommodation & food services
-1.1
1.7
1.6
0.0
0.0
0.0
Information & communications
5.8
3.1
1.2
0.2
0.1
0.0
Finance & insurance
6.6
2.7
0.8
0.8
0.3
0.1
Business services
0.6
0.1
-0.2
0.1
0.0
0.0
Other Service Industries
1.2
0.8
1.6
0.1
0.1
0.2
Overall GDP
1.7
2.1
2.1
Source: Ministry of Trade and Industry Singapore
Table 17 Demand Conditions (%)
Year-on-Year Growth
% Contribution to GDP Growth
2Q 2015 1Q 2016 2Q 2016 2Q 2015 1Q 2016 2Q 2016
Total Domestic Demand
1.8
9.6
-4.0
0.5
2.4
-1.1
-Consumption expenditure
3.8
5.3
4.8
0.6
0.9
0.8
-Investment spending
2.3
-2.8
1.1
0.2
-0.3
0.1
-Inventories
-0.9
4.7
-5.2
-0.3
1.8
-1.9
External Demand
0.4
-1.0
4.1
0.3
-0.7
3.0
Total Demand
0.8
1.7
1.9
Source: Ministry of Trade and Industry Singapore
wholesale & retail trade
sector.
Demand
Conditions
Year-on-
year, total
demand
gained 1.9%
in 2Q 2016,
driven by the
4.1% increase
in external
demand – see
table 17
. On the
other hand, total
domestic demand
contracted by 4.0% in
2Q 2016, in contrast to a
9.6% growth in the previous
quarter. Domestic demand
was pulled down by lower
inventory investment.
Labour Market and
Productivity
Total employment
rose by 5,500, quarter-
on-quarter, in 2Q
2016, slower than the
13,000 growth in the
preceding quarter.
The slowdown in
employment growth
was broad based.
Manufacturing
employment declined
for the seventh
consecutive quarter in 2Q
2016, falling by 3,400, as
a result of continued weak
performance in the transport
engineering clusters.
Meanwhile, construction
and services employment
rose by 8,600 and 400
respectively in 2Q 2016,
both slower than the growth
in the first quarter.
Year-on-year, total labour
productivity grew by 0.7% in
2Q 2016. The manufacturing
and wholesale & retail
trade industries reported
productivity growth of 4.6%
and 2.2% respectively.
However, productivity in the
business services sector
declined by 2.7%, year-on-
year.
Table 18 Balance of Payments (S$ mln)
2Q 2015 1Q 2016 2Q 2016
Goods balance
26,926.9 26,495 30,382.7
Exports of goods
130,730.9 115,739.1 125,310.8
Imports of goods
103,804 89,244.1 94,928.1
Balance of services
-2,363.5 -2,046.4
-2,748
Income balance
-7,784.3 -5,601.9 -6,782.5
Current account balance
16,779.1 18,846.7 20,852.2
Capital & financial account balance 13,322 26,898.3 15,781.9
Overall balance
2,686.5 -8,720.3 4,757.3
Source: Ministry of Trade and Industry Singapore
Table 19 Consumer Price Index
%change fromprior year %change fromprior quarter
2Q 2015 1Q 2016
2Q 2016
2Q 2016
Food
1.9
2.0
2.2
0.3
Clothing & Footwear
-0.6
2.1
0.6
-1.5
Housing & Utilities
-3.8
-4.1
-4.2
-2.3
HouseholdDurables &Services
-0.7
-0.8
2.3
1.4
Health Care
-0.3
0.7
0.9
0.7
Transport
0.1
-2.9
-5.2
0.5
Communication
1.0
-1.1
-0.5
0.0
Recreation & Culture
-0.1
0.4
1.2
0.6
Education
3.1
2.5
3.2
0.7
MiscellaneousGoods&Services
-0.3
0.5
0.4
0.1
Overall
-0.4
-0.8
-0.9
-0.2
Source: Department of Statistics Singapore
Price, Interest, and
Exchange Rates
Year-on-year, the CPI
fell by 0.9% in 2Q 2016.
As shown in
table 19
the
housing & utilities and
transport sectors were,
again, the main contributors
to the fall in the CPI. In
contrast, the costs of
food, household durables
& services, as well as
education continued to rise
in 2Q 2016. On a quarter-
on-quarter basis, the CPI
declined by 0.2%.
At the end of 2Q 2016,
the prime lending rate
stayed flat at 5.35%. In
terms of interest rates at
the 10 leading banks, the
12-month fixed deposit rate
and the savings deposit
rate remained unchanged
at 0.35% and 0.14%
respectively in 2Q 2016.
In 2Q 2016, the S$
appreciated 7.1% against
the Pound, 3.1% against
the Australian $, 2.9%
against the Chinese Yuan,
2.7% against the Malaysian
Ringgit, 2.1% against the
Euro, 0.2% against the US$
and 0.2% against the HK$.
On the other hand, the S$
depreciated 8.4% against
the Japanese Yen.
Comments
In 2Q 2016, the
Singapore economy
expanded by 2.1%, year-on-
year. Going forward,
economic conditions remain
challenging. Externally,
significant downside
risks could come from
the uncertainty arising
from Brexit as well as the
confusing monetary policy
in US. Domestically, growth
of external-oriented services
sectors could be adversely
affected by the softening
global economic conditions.
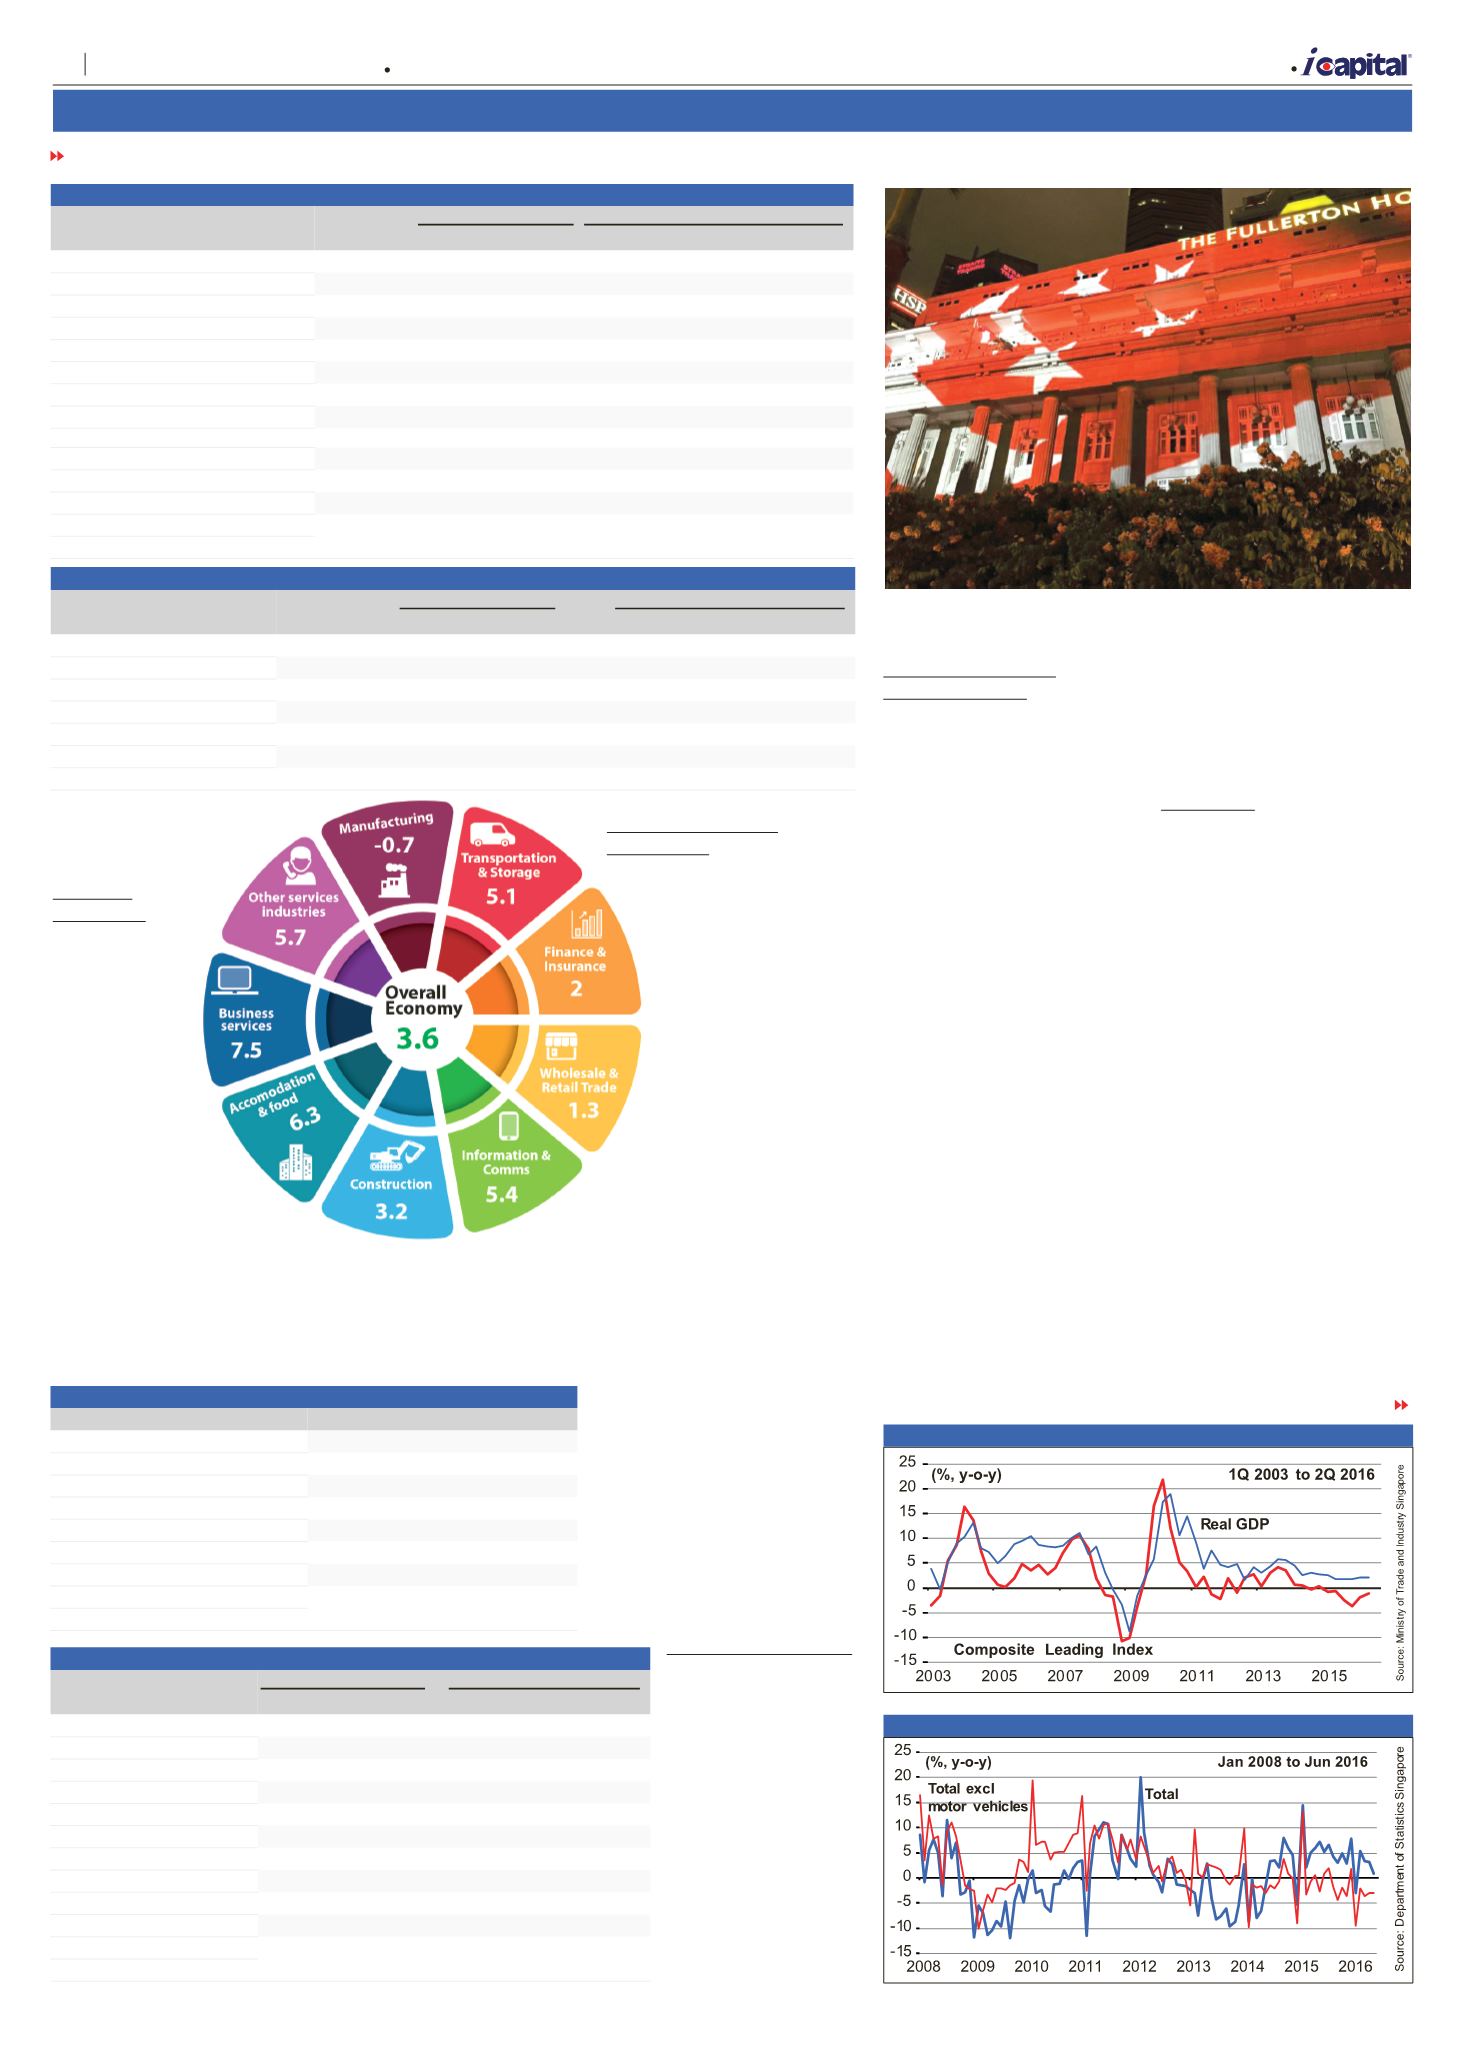
Reflecting these
developments, the
composite leading index
(CLI) declined by 1.1%,
year-on-year, in 2Q 2016 –
see
figure 11.
i
Capital revises its forecast
of Singapore’s real GDP
FROM PAGE 5
TURN TO PAGE 7
Balance of Payments
In 2Q 2016,
Singapore’s balance
of payments recorded
a surplus of 4.8 bln,
compared with an
8.7 bln deficit in the
previous quarter. This
reflected a larger
current account
surplus as well as a
smaller net outflow
in the capital and
financial account –
see
table 18
.
Figure 11 Real GDP Growth
Figure 12 Retail Sales
A
| Market Opinion
6
Capital Dynamics Sdn Bhd