


 5 / 36

The week of 18 August – 24 August 2016
Volume 28 Number 01
multi-family housing starts
increased 15.2% to 433,000
units. Meanwhile, building
permits, an indication of
future construction activity,
fell 0.1% from Jun, but rose
0.9% from a year ago to a
SAAR of 1.152 mln units.
Initial claims
The seasonally adjusted
initial claims for the week
Source:
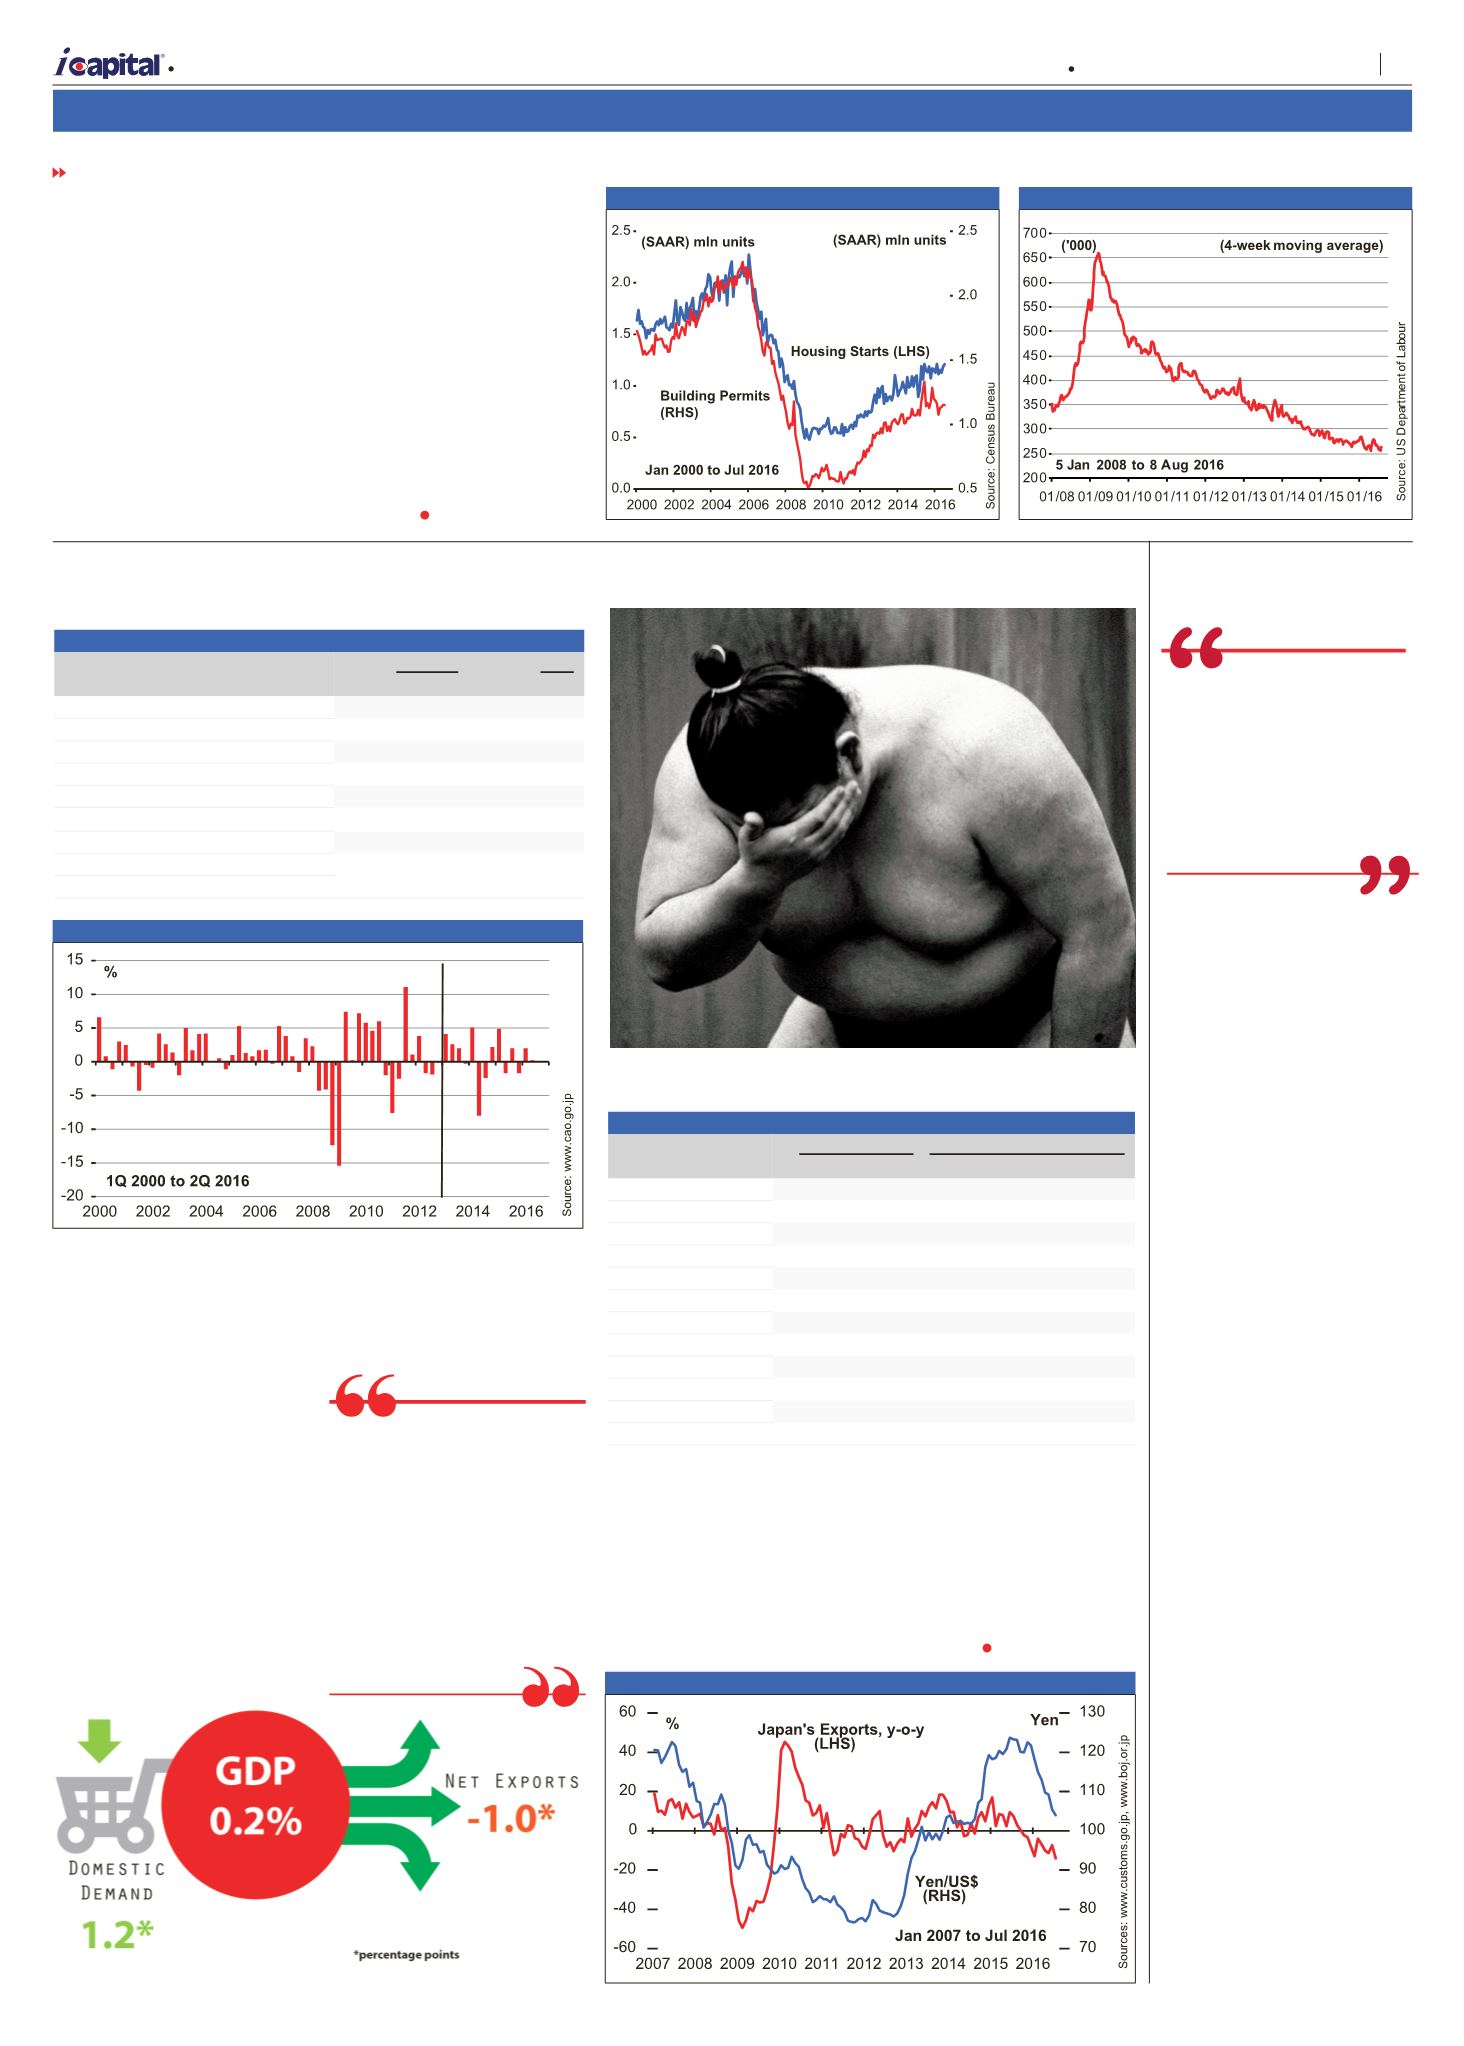
flickr.com/EricLafforgueWith Japan’s population fast ageing and contracting, will the sumo
wrestlers become extinct too?
ending 6 Aug 2016 were
266,000, down 1,000 from
the previous week. The
4-week moving average
rose 3,000 from the
previous week to 262,750
– see
figure 8
. Continuing
jobless claims for the
week ending 30 Jul 2016
registered a seasonally
adjusted 2.155 mln, up
14,000 from the previous
week; the 4-week moving
average increased by 500 to
2.143 mln.
Japan
Table 14 2Q 2016 GDP (% change)
q-o-q
Nominal
y-o-y q-o-q
Real
y-o-y
GDP
0.2
1.3 0.0 0.6
Domestic demand
0.1
-0.2 0.3 0.5
Public demand
0.3
0.7 0.6 1.4
Private demand
0.0
-0.5 0.2 0.2
Private consumption
-0.1
-0.3 0.2 0.4
Private non-residential investment
-0.6
-0.5 -0.4 0.6
Exports of goods and services
-3.5
-9.3 -1.5 -0.1
Imports of goods and services
-4.5 -16.7 -0.1 -0.6
Source:
www.cao.go.jpTable 15 Exports
Area/country
Value (bln Yen)
Jul 2016
% change from a year ago
Jul 2016
Asia
3,043.8
-13.9
China
1,029.9
-12.7
S. Korea
409.0
-9.2
Taiwan
358.7
-11.6
North America
1,247.7
-11.9
USA
1,182.5
-11.8
Western Europe
675.9
-5.4
Germany
160.7
-8.8
UK
131.8
6.2
France
53.4
-3.0
Total
5,728.4
-14.0
Source:
www.customs.go.jpGDP
In 2Q 2016, Japan’s real
GDP rose by a SAAR of
0.2% – see
figure 9
. Growth
was supported mainly by
government spending as
net exports subtracted 0.3
ppt from growth in 2Q 2016.
On a year-on-year basis, the
economy rose 0.6% – see
table 14
.
In the first half of 2016,
Japan’s economy rose 0.4%
from a year ago. Given the
latest stimulus package
announced by the Abe
government,
i
Capital revises
its forecast for Japan’s
economic growth in 2016 to
Source:
www.cao.go.jpJapan: Contribution to 2Q 2016 GDP Growth
imports plunged 14.0% and
24.7% from a year ago to 5.7
trillion Yen and 5.2 trillion Yen
respectively, giving rise to a
trade surplus of 513.5 bln Yen
– see
table 15
. Soft external
demand and the rising Yen
are adversely affecting
Japan’s exports – see
figure
10
. Exports to China and
the US plunged. On the
other hand, the rising Yen
and weak domestic demand
are dampening the value of
imports. Unfortunately, this
unfavourable condition is not
expected to change in the
near future.
be in the range of 0-1%.
External trade
In Jul, exports and
Given the latest
stimulus package
announced by the
Abe government,
i
Capital revises its
forecast for Japan’s
economic growth
in 2016 to be in the
range of 0-1%
Performance of the
Singapore Economy in 2Q
2016
Singapore’s economy
grew by 2.1%, year-on-
year, in 2Q 2016. Both
goods-producing and
services-producing
industries contributed to the
expansion in 2Q 2016 – see
table 16
. On a quarter-
on-quarter seasonally
adjusted annualised terms,
Singapore’s economy grew
by 0.3%, marginally higher
than the last quarter.
Year-on-year,
output from the goods-
producing industries grew
by 1.6% in 2Q 2016,
supported by expansion
in the manufacturing and
construction industries.
The manufacturing sector
expanded by 1.1% from a
year ago, a reversal from a
0.5% decline in the previous
quarter. The electronics and
biomedical clusters were
the main contributors to the
growth of the manufacturing
industries.
The services-producing
industries expanded by
1.4% from a year ago in 2Q
2016, slower than in the
previous quarter. With the
exception of the business
services sector, all the other
sectors in the services-
producing industries grew
in 2Q 2016. The transport
& storage sector grew the
fastest by 2.9%, followed by
a 2.2% expansion in the
FROM PAGE 4
Figure 9 Japan’s Real GDP Growth Annualised
Figure 10 Japan’s Exports
Figure 7 Housing Starts and Building Permits
Figure 8 Initial Claims
Singapore
Singapore’s
economy
grew by 2.1%,
year-on-year, in
2Q 2016.
A
| Market Opinion
5
Capital Dynamics Sdn Bhd