


 2 / 46

i
Capital
®
Volume 25 Number 17
Capital Dynamics Sdn Bhd
2
Section A :
Market Opinion
This section is based on a top-down/market-timing approach. In each
issue of i
Capital
®
, Capital Dynamics will look at the major economic
variables, locally and abroad, major equity markets plus some
technical indicators before reaching its conclusion for the KLSE
Composite Index. In other words, Section A should be read in toto.
A.1. Economic Fundamentals
Data to be expected (Date in parentheses is actual release date).
Dec 16 – 22
Dec 23 – 29
Malaysia
(18 Dec) Nov consumer price index
US
(16 Dec) Nov industrial production
Nov personal income
(17 Dec) Nov consumer price index
Nov personal consumption
(18 Dec) FOMC meeting
Nov new home sales
(18 Dec) Nov housing starts
Nov durable goods orders
(19 Dec) Nov leading index
21 Dec initial claims
(19 Dec) Nov money supply
(19 Dec) Nov existing home sales
(19 Dec) 14 Dec initial claims
(20 Dec) 3Q GDP – 3rd estimates
Japan
(16 Dec) Dec
tankan
Nov consumer price index
(18 Dec) Nov external trade
Nov retail sales
Nov industrial production
Nov employment report
Nov household spending
Nov housing starts
China
(18 Dec) Nov house prices
A.1. (i). Malaysia
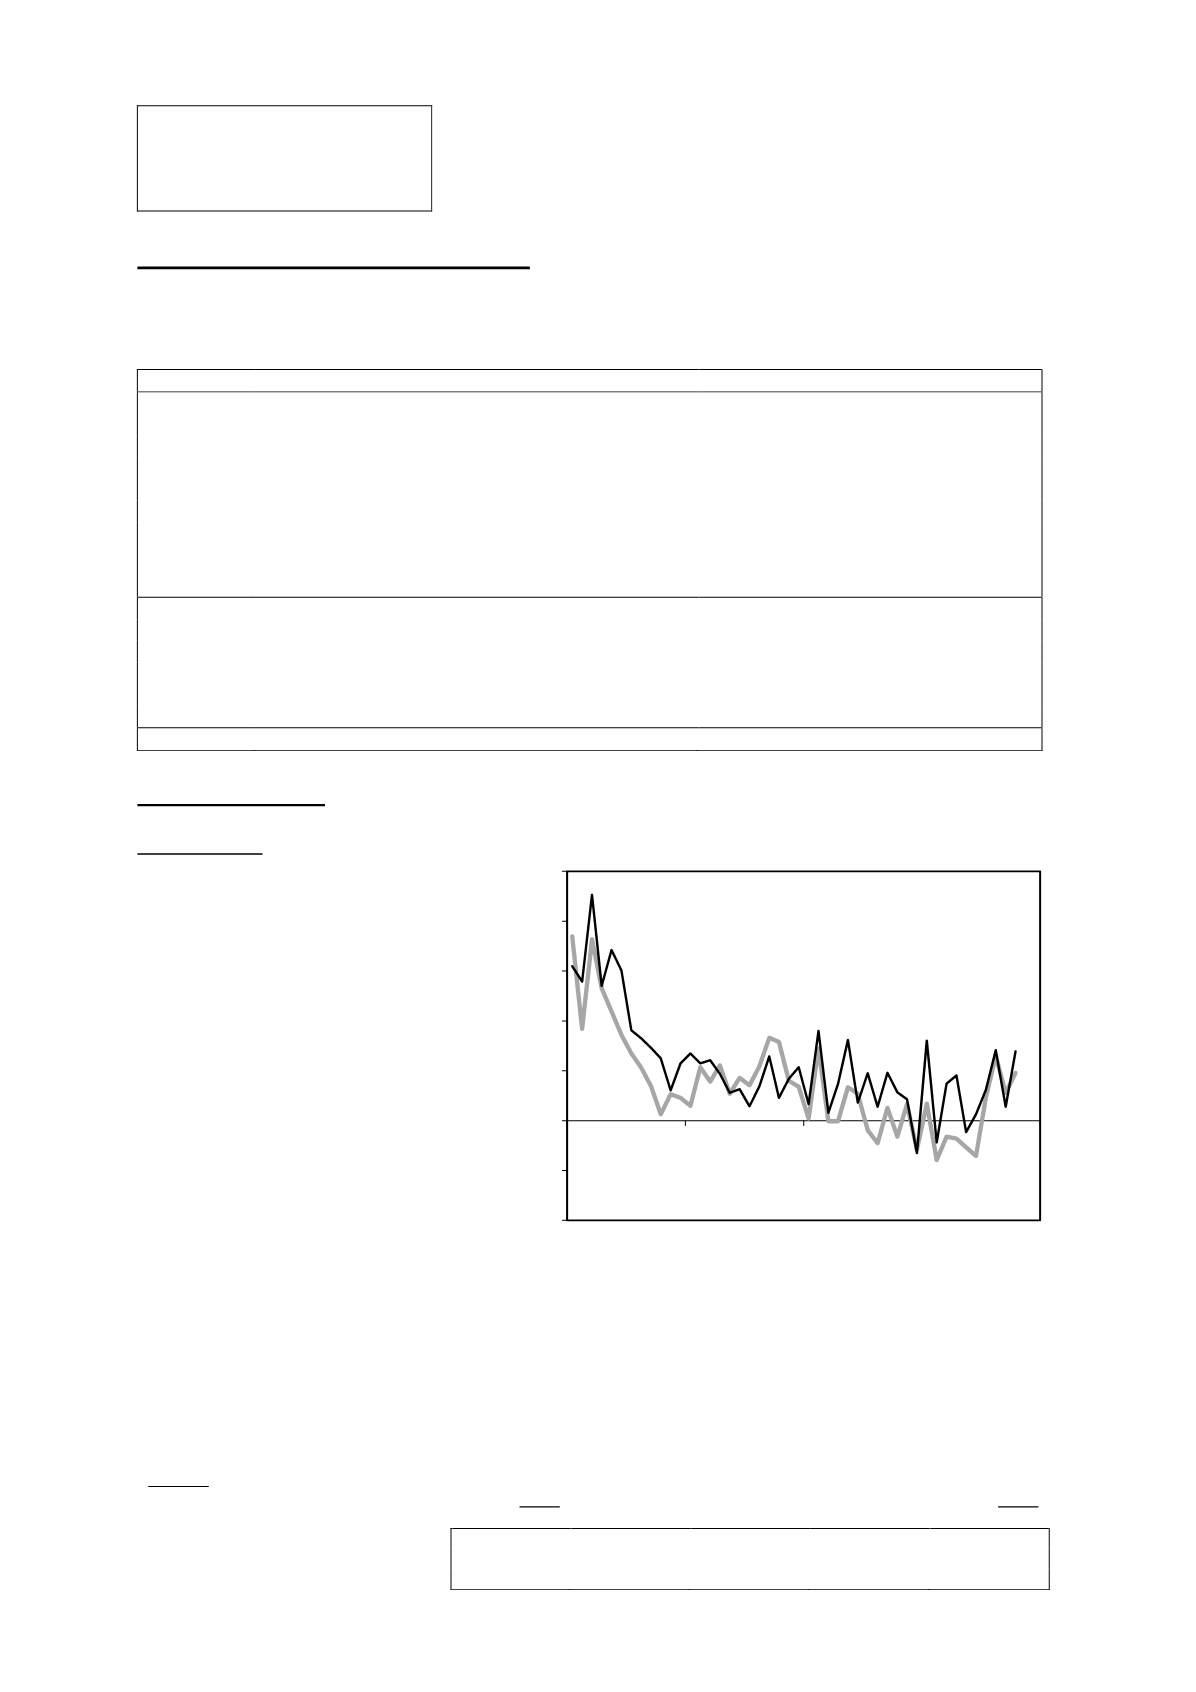
External trade
In Oct, exports rose by 9.6%, year-on-
year, to RM67.11 bln – see
figure 1
.
Import growth accelerated to 13.9%,
year-on-year, at RM58.88 bln. The
trade surplus narrowed slightly to
RM8.23 bln.
Year-on-year, the exports of major
commodities grew by 6.2%, while the
growth of manufactured exports surged
to the highest pace this year, at 11.2%
– see
table 1
. This was mainly led by
higher exports of electrical and
electronic (E&E) products, petroleum
products, liquefied natural gas and
crude petroleum. Negative contributors
include palm oil products.
On the other hand, the year-on-year imports of consumption, capital and intermediate goods all went
up in Oct. The imports of intermediate goods were supported by parts & accessories of capital goods
and fuel & lubricants.
Manufactured products and total exports in the first 10 months of 2013 posted the first positive growth
since Feb 2013. Going forward, Malaysia’s exports are expected to be supported by the strengthening
of the economies of China and Europe.
Table 1: Exports
(y-o-y % change)
2013
2013
Jul
Aug
Sep
Oct
Jan-Oct
Major commodities
3.8
15.2
5.5
6.2
-0.6
Major manufactured products
4.1
10.6
4.0
11.2
0.8
Total exports
4.6
13.0
5.6
9.6
0.9
-20
-10
0
10
20
30
40
50
2010
2011
2012
2013
Figure 1: Exports and Imports
(y-o-y)
%
Imports
Exports
Jan 2010 to Oct 2013