


 3 / 46

i
Capital
®
Volume 25 Number 17
Capital Dynamics Sdn Bhd
3
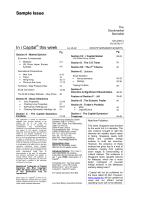
Employment
In Oct, employment in the
manufacturing
sector
grew
marginally by 0.01% from Sep.
Year-on-year,
employment
growth slowed to 0.6% – see
figure 2
. Employment in the
export-oriented
industries
decreased for the 10th month in a
row, down by 1.3%. On the other
hand, employment in the
domestic-oriented industries rose
by 3.5%, although this marked
the 45th consecutive month of
increase, it represented the
slowest growth in eight months.
The average salaries and wages per employee fell 1.4%, month-on-month, and increased steadily by
9.3%, year-on-year, to RM2,675 in Oct. Going forward, employment in the export-oriented industries is
likely to stay subdued since there is no clear indication of a significant pickup in external demand for
Malaysia’s manufactured products.
Industrial production
In Sep, the year-on-year growth of industrial production accelerated slightly to 1.7%. As shown in
table 2
, the rebound was largely led by the manufacturing and electricity sectors. Positive contributors
to the higher manufacturing growth include E&E products, machinery, textile, chemical products and
rubber. Natural gas production increased robustly by 12.8% year-on-year, but this was largely offset
by a similar magnitude of decrease in crude oil production. Output growth from the export-oriented
industries outpaced that of the domestic-oriented industries for the first time in eight months, rising by
3.6% and 2.8%, year-on-year, respectively.
The mild rebound in manufacturing output is encouraging. Going forward, industrial production is
expected to pick up amid recovering demand for manufacturing products.
Table 2: Industrial Production
(y-o-y % change)
2013
2013
Jul
Aug
Sep
Oct
Jan-Oct
Total
7.5
2.8
1.0
1.7
2.4
Manufacturing
5.4
5.2
2.4
3.3
2.8
Mining
15.4
-4.6
-4.3
-3.6
0.5
Electricity
6.1
5.1
3.9
4.8
5.3
Sales value
In Oct, the manufacturing sales value accelerated slightly to a year-on-year growth of 1.9% from a
three-month-low of 1.5% in Sep – see
table 3
.
Positive contributors to the sales value growth are: motor vehicles, electronic related products,
television and radio related apparatus and computer. Industries posted lower sales value growth
included refined petroleum products, industrial chemicals, semi-conductor devices, vegetable and
animal oils manufactured products and rubber re-milling. Sales value of the export-oriented industries
slip 0.2%, year-on-year, while sales value of the domestic-oriented industries climbed by 7.2%. The
strong sales value of the transport and electronic products industries are encouraging. However, the
weak performance of the export-oriented industries is worrying.
The cumulative sales value during Jan-Oct 2013 slipped 0.7% from the same period in 2012.
Table 3: Sales Value
(y-o-y % change)
2013
2013
Oct
Jan-Oct
Veneer sheets & plywood
-5.7
4.8
Refined petroleum products
-6.7
-3.3
Basic iron & steel products
6.2
-7.0
Plastics in primary forms & of synthetic rubber
3.2
3.4
T.V & radio receivers, sound or video recording or reproducing apparatus etc.
26.0
11.6
Semiconductor devices
-10.7
-12.4
Industrial gases
76.1
24.3
Computers & computer peripherals
7.9
-8.5
Motor vehicles
339.2
69.2
-6
-4
-2
0
2
4
6
8
10
12
%
Jan 2010 to Oct 2013
Export-oriented industries
Domestic-oriented
industries
Overall
Figure 2: Manufacturing Employment
(y-o-y)