


 7 / 46

i
Capital
®
Volume 25 Number 17
Capital Dynamics Sdn Bhd
7
The annual growth rate of money supply, M2, at the end of Nov slowed slightly to 14.2% from 14.3%
at the end of Oct. Monetary expansion is exceeding the government’s 13% target to ensure a stable
economic growth.
Japan
Japan’s economic growth in 3Q 2013 was revised downwards to a SAAR of 1.1% from 1.9%
estimated last month. This was due mainly to a slower increase in private non-residential investment –
see
table 10
. Nevertheless, Japan’s economy is on course to achieve
i
Capital’s forecasted growth
range of 1.0-2.0% in 2013. Going forward, the sales tax increase in Apr 2014 could temporary boost
private consumption in the first quarter of 2014 and the 5.5 trillion Yen of stimulus package should
cushion the economy from the adverse impact of the sales tax hike. However, the real challenge lies
beyond the short-term outlook, which calls for serious structural reform to the Japanese economy.
Table 10: 3Q 2013 GDP – comparisons of the 1st and 2nd estimates (q-o-q, %)
Nominal
Real
1st
2nd
1st
2nd
GDP
0.4
0.3
0.5
0.3
Domestic demand
1.1
0.9
0.9
0.7
Public demand
1.4
1.6
1.6
1.4
Private demand
0.9
0.7
0.7
0.5
Private consumption
0.4
0.5
0.1
0.2
Private non-residential investment
0.4
0.2
0.2
0.0
Exports of goods and services
0.8
0.8
-0.6
-0.6
Imports of goods and services
4.5
4.5
2.2
2.2
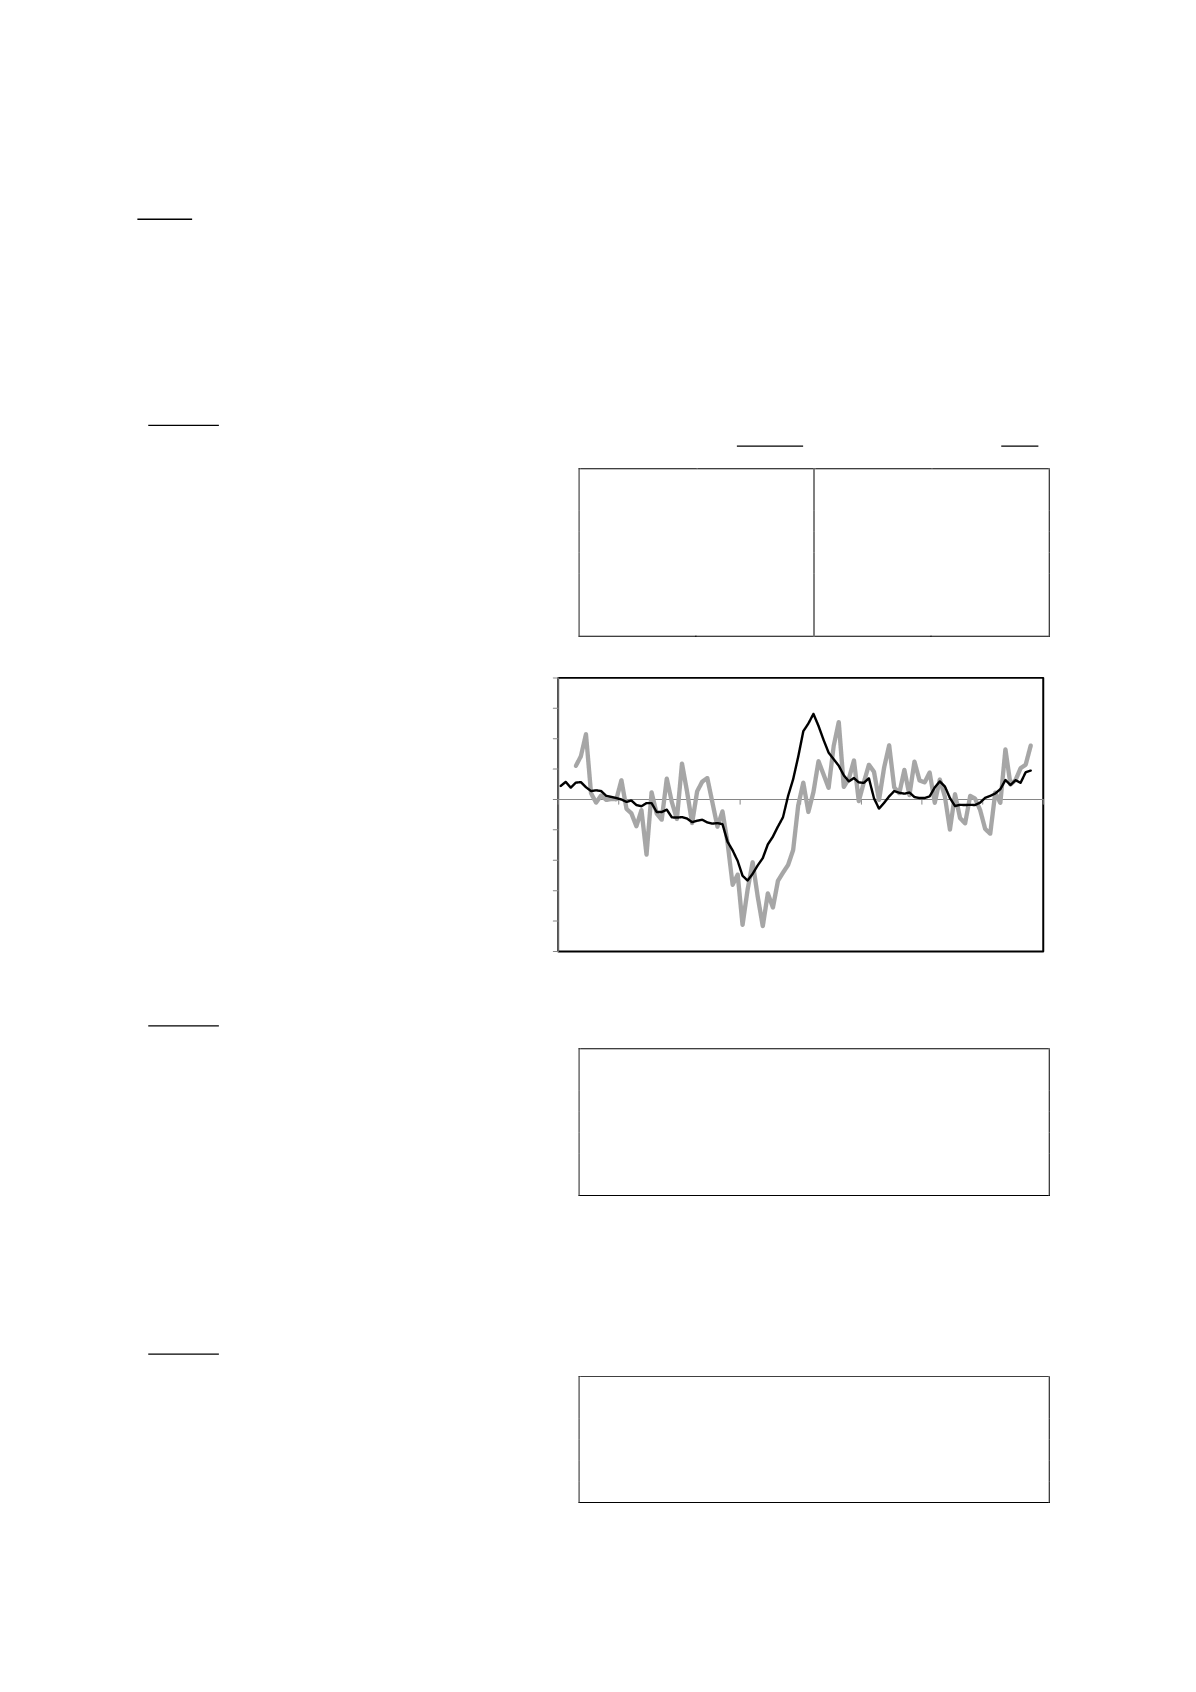
Core machinery orders in Oct rose
0.6%, month-on-month, and 17.8%,
year-on-year – see
table 11
.
Supported
by
rising
business
sentiments, core machinery orders
have risen strongly since the beginning
of the year – see
figure 8
. This was
underpinned by the fiscal pump
priming under the second arrow of
Abenomics. The 5.5 trillion Yen fiscal
stimulus package to offset the impact
of the sales tax hike should continue to
support investment spending in the
months ahead.
Table 11: Machinery Orders
(% change)
Month-on-month
Year-on-year
Total
-4.6
24.6
Private sector
7.0
20.7
Excluding volatile orders
0.6
17.8
Manufacturing
-0.2
21.9
Non-manufacturing (excluding volatile orders)
11.5
15.1
Government
-26.2
24.1
From overseas
-16.0
29.7
In Nov, the domestic corporate goods price index (DPI) rose 0.1%, month-on-month, and 2.7%, year-
on-year – see
table 12
. The weak Yen has caused inflation at the producer level to rise above 2% for
the 4th month in a row. The consumer price index should follow in the similar direction, albeit at a
slower pace.
Table 12: Domestic Corporate Goods Price Index
(% change)
Month-on-month
Year-on-year
All commodity
0.1
2.7
Manufacturing industrial products
0.0
1.9
Agriculture, forestry, & fishing products
1.4
2.2
Minerals
0.0
4.1
Electric power, gas, & water
-0.5
10.8
Scrap & waste
5.5
38.1
Bank lending continued its steady expansion in Nov, rising 2.4% from a year ago. As shown in
table
13
, loans from all categories of banks rose steadily in Nov. This is a positive development as it
indicates a broadening of economic growth.
-50
-40
-30
-20
-10
0
10
20
30
40
2006 2007 2008 2009 2010 2011 2012 2013
%
Figure 8: Core Machinery Orders and Business Conditions
(y-o-y)
Core Machinery Orders
Business Conditions
Composite Leading Index
Jan 2006 to Oct 2013