


 6 / 46

i
Capital
®
Volume 25 Number 17
Capital Dynamics Sdn Bhd
6
In the first 11 months of 2013, exports
and imports expanded by 8.3% and
7.1% respectively from the same period
a year ago to US$2.0 trillion and US$1.8
trillion, giving rise to a trade surplus of
US$234.15 bln.
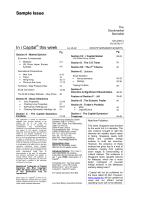
In Nov, industrial production rose
0.76%, month-on-month, and 10.0%,
year-on-year. Output growth was broad-
based, with 39 of the 41 major industries
recording increases in output. The
stable performance is in line with the
steady
manufacturing
purchasing
managers index – see
figure
4
.
In Jan-Nov 2013, industrial production rose 9.7% from the corresponding period last year.
In Nov, retail sales rose 1.32%, month-on-month, and 13.7%, year-on-year. After factoring out the
price factor, real retail sales rose 11.8%, year-on-year – see
figure 5
. Retail sales rose across the
board. This favourable performance reflected firm consumer confidence over the job prospects and
economic outlook. In Jan-Nov 2013, retail sales rose 13.0% from the corresponding period last year.
Fixed asset investment (excluding rural households) in Jan-Nov 2013 expanded by 19.9% from the
same period a year ago, down slightly from the 20.1% increase in Jan-Oct 2013, and the first below
20% reading since the early 2000s – see
figure 6
. Investment in the secondary industry slowed
considerably to get rid of excess capacity and allow the economic restructuring programme to take
place.
Total vehicle sales in Nov rose 5.75%, month-on-month, and 14.12%, year-on-year, to a record 2.04
mln units – see
table 9
. Reflecting continued firm demand for automobiles, passenger vehicle sales in
Nov were the second highest on record. Sales of Japanese cars have recovered significantly. Going
into 2014, the outlook for China’s auto sales remains favourable due to rising income and still low car
ownership.
Table 9: Vehicle Sales
mln units
year-on-year % change
Nov 2013 Jan-Nov 2013
Nov 2013 Jan-Nov 2013
Total
2.04
19.86
14.12
13.53
Passenger
1.70
16.15
16.08
15.10
Commercial
0.35
3.71
5.42
7.15
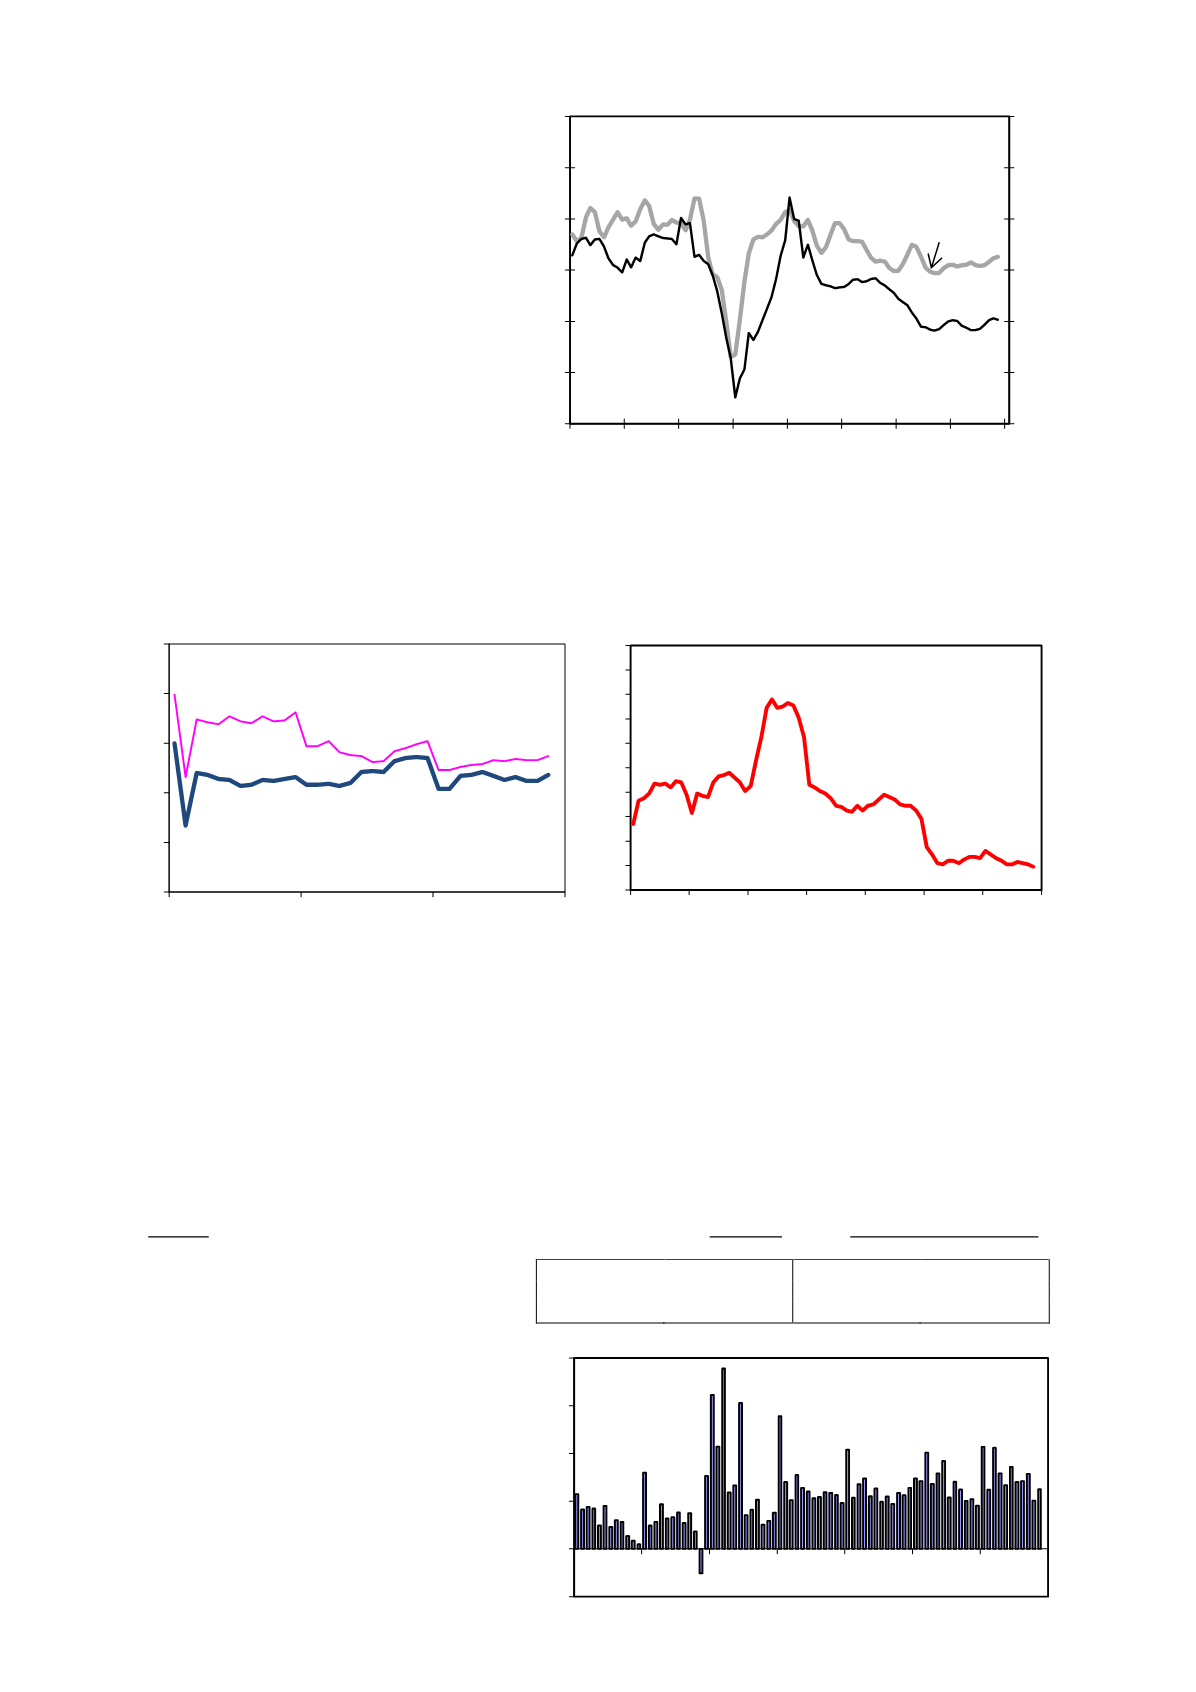
Renminbi bank loans outstanding at
the end of Nov were RMB71.41 trillion,
up 14.2% from a year ago. RMB624.6
bln of new bank loans were created in
Nov, slightly higher than the preceding
month – see
figure 7
. In the first 11
months of 2013, RMB8.41 trillion of
new bank loans were created,
RMB660.0 bln more than the same
period a year ago. The government is
maintaining stable credit financing to
ensure a stable economic growth.
0
5
10
15
20
25
30
35
40
45
50
55
60
65
2006 2007 2008 2009 2010 2011 2012 2013 2014
Figure 4: Industrial Production and Manufacturing PMI
Manufacturing PMI
(LHS)
Industrial Production (RHS)
(y-o-y)
%
%
(3-month moving average)
Jan 2006 to Nov 2013
18
20
22
24
26
28
30
32
34
36
38
2007 2008 2009 2010 2011 2012 2013
%
(y-o-y)
Figure 6: Cumulative Fixed Asset
Investment (Excluding rural households)
Jan 2007 to Nov 2013
0
5
10
15
20
25
2011
2012
2013
Figure 5: Retail Sales
(y-o-y)
%
Real
Nominal
Jan 2011 to Nov 2013
-500
0
500
1000
1500
2000
2007 2008 2009 2010 2011 2012 2013
Figure 7: Renminbi Bank Loans
(m-o-m)
RMB bln
Jan 2007 to Nov 2013