


 4 / 46

i
Capital
®
Volume 25 Number 17
Capital Dynamics Sdn Bhd
4
Tourist arrivals
In Sep, total tourist arrivals reached 2.09 mln, up 5.7% from Aug. Year-on-year, it rose 6.1%, the
strongest growth in six months. Arrivals from regional countries such as China, Japan, Vietnam and
Taiwan continued to post double-digit year-on-year growth in Sep. One exception was Thailand,
whose tourist arrivals have declined on a year-on-year basis since Jan 2013. Tourists from Singapore,
Indonesia and China accounted for a combined 68.9% of total tourist arrivals in Sep.
In Jan-Sep 2013, total tourist arrivals climbed 3.3% from the same period last year. As 2014 has been
declared Visit Malaysia Year, a series of promotional activities is expected to lead to more tourist
arrivals next year.
A.1. (ii). International
US
In the second estimate, real GDP growth in 3Q 2013 was revised substantially upwards to a seasonally
adjusted annual rate (SAAR) of 3.6%.The upward revision primarily reflected an upward revision to
private inventory investment – see
table 4
. Meanwhile, private consumption grew at a slower rate than
estimated previously. Economic data for 4Q 2013 remains largely favourable. Hence,
i
Capital
maintains its forecast that the US economy will grow in the range of 2-3% for the whole of 2013.
Table 4: 3Q 2013 GDP
1
(% change, annual rate)
2
(percentage points)
Growth
1
(q-o-q)
Contribution to growth
2
2Q 2013
Advance
estimate
3Q 2013
2nd
estimate
3Q 2013
2Q 2013
Advance
estimate
3Q 2013
2nd
estimate
3Q 2013
Real GDP
2.5
2.8
3.6
-
-
-
Nominal GDP
3.1
4.8
5.6
-
-
-
Personal consumption expenditure
1.8
1.5
1.4
1.24
1.04
0.96
Gross private domestic investment
9.2
9.5
16.7
1.38
1.45
2.49
Exports
8.0
4.5
3.7
1.04
0.60
0.50
Imports
6.9
1.9
2.7
-1.10
-0.30
-0.43
Govt consumption & investment
-0.4
0.2
0.4
-0.07
0.04
0.09
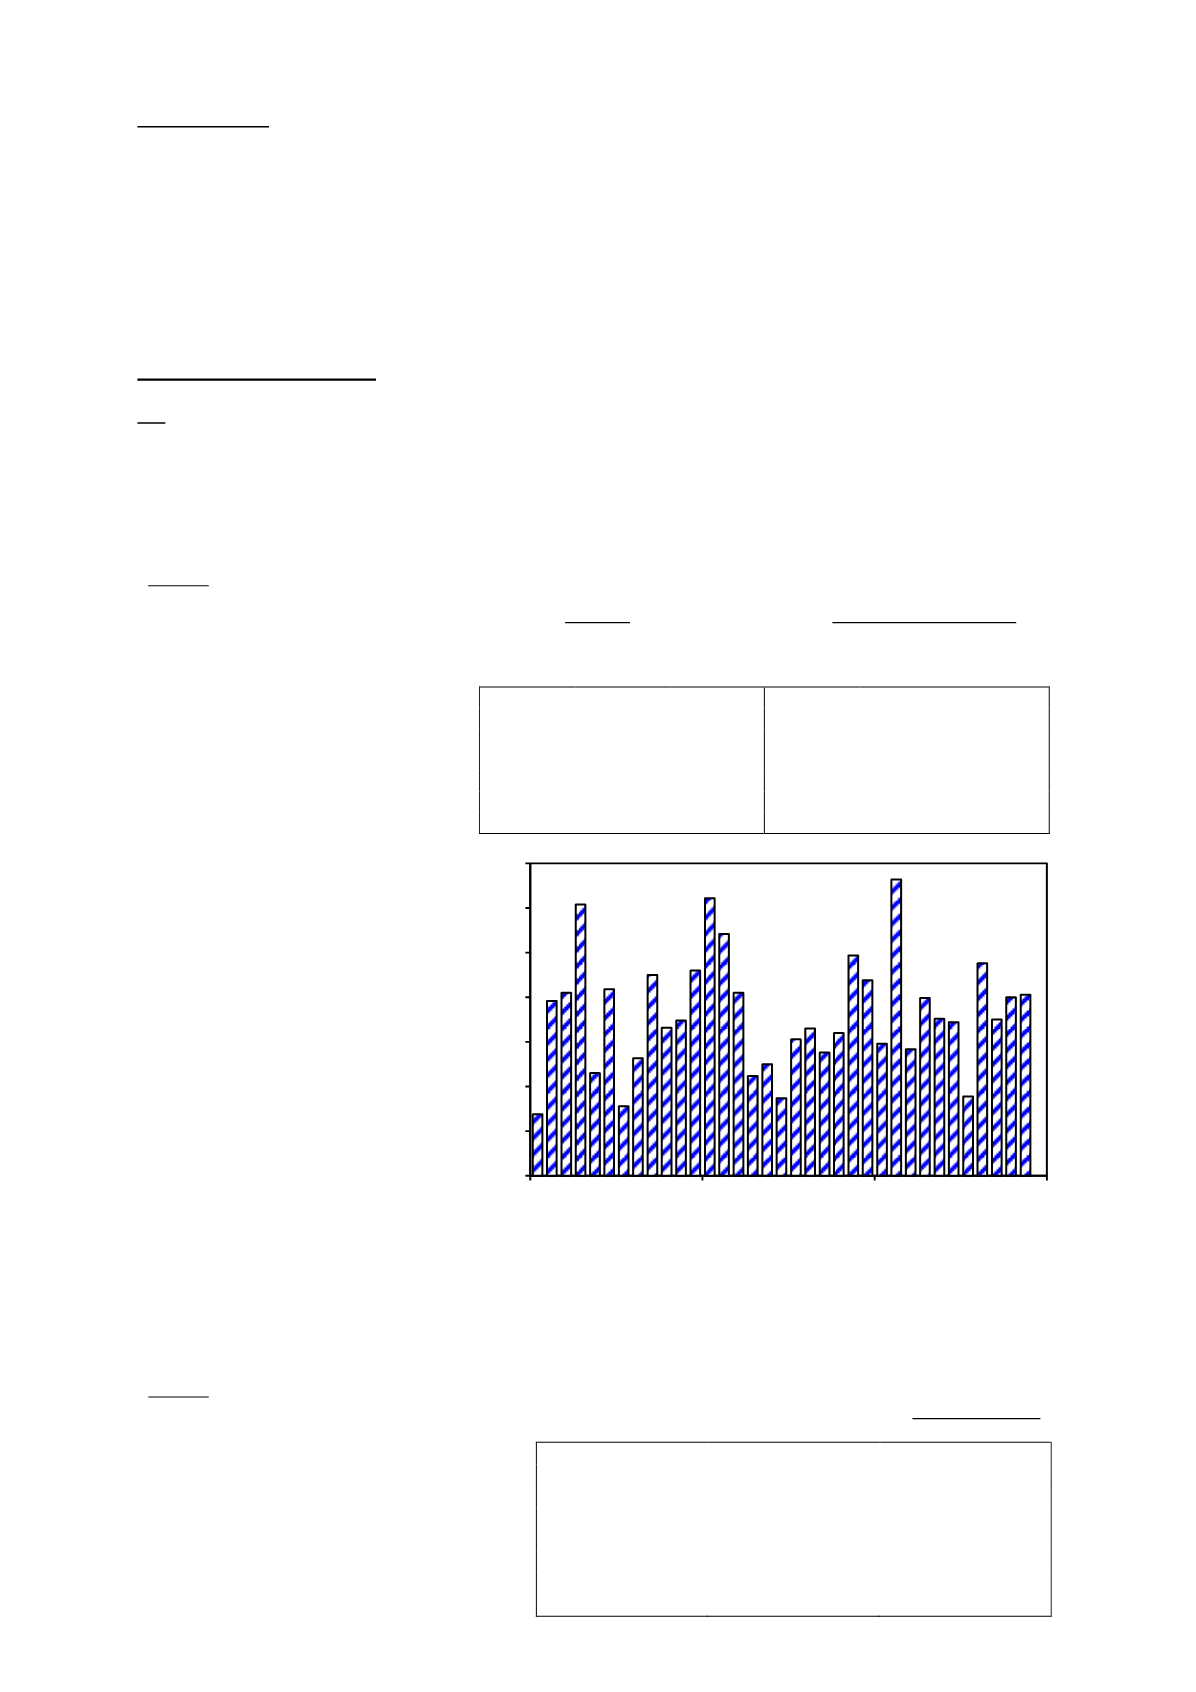
The labour market strengthened
substantially in Nov, with the non-
farm payrolls increasing by
203,000. In addition, revisions to
Sep’s and Oct’s numbers resulted
in an additional gain of 8,000 in
employment
than
previously
reported – see
figure 3.
As shown
in
table 5
, job gains in Nov
continued to come largely from the
service-producing
industries.
However, the goods-producing
industries have been contributing
steadily as well, signaling an across
the board recovery.
The unemployment rate in Nov fell by 0.3 percentage points (ppts) from Oct to 7.0%, the lowest level
in 6 years. Meanwhile, the average hourly earnings rose by 4 cents to US$24.15, while the average
workweek edged up by 0.1 hour to 34.5 hours.
The Nov employment report was better than expected. The Federal Reserve is expected to
commence its monetary tightening exercise before 2014.
Table 5: Non-farm Payrolls
(’000)
Monthly change
Sep 2013
Oct 2013
Nov 2013
Non-farm employment
175
200
203
Goods-producing industries
29
31
44
Construction
17
12
17
Manufacturing
8
16
27
Service-providing industries
13.9
183
152
Retail trade
23.3
45.8
22.3
Transportation and warehousing
36.9
3.1
30.5
Information
2
4
-1
0
50
100
150
200
250
300
350
2011
2012
2013
'000
Figure 3: Non-farm Payrolls
Jan 2011 - Nov 2013
(month-on-month)